TL;DR: ICICI Bank appears in 90% of large-cap funds' top holdings. Reliance is in 90% too. Most funds have 80-90% portfolio overlap. If you're holding 2 large-cap funds, you're paying 2 fund managers for the same stocks with zero diversification benefit. Here's what the data says about which fund to pick.
I spent the weekend analyzing 20 large-cap mutual funds to find the best large cap mutual fund for different investor profiles, every direct growth plan with a meaningful track record. Not just the basic returns you see on fund house websites, but the data that actually matters: which stocks they hold, how much risk they take, what happens during crashes, and whether they perform consistently or just get lucky.
I pulled performance data (1-month to 10-year returns), risk metrics (volatility, Sharpe ratio, maximum drawdown), rolling returns (consistency check), complete portfolio holdings (top 10-20 stocks with exact allocations) from the AMFI mutual fund database, sector breakdowns, market cap splits (are they really "large cap"?), and expense ratios.
The goal: figure out which large-cap fund actually makes sense. Are they all the same? Is the ₹75,000 Cr ICICI fund better than the ₹3,000 Cr quant fund? Does expense ratio matter when returns vary by 9 percentage points?
Here's what I found.
What I Analyzed
Data as of: June 12, 2026 (sourced from AMC websites and AMFI database)
Funds: 20 large-cap direct growth plans Filters: Large Cap category only, direct plans only (no regular), growth option only (no IDCW)
Data collected per fund:
- Performance: 1M, 3M, 6M, 1Y, 3Y, 5Y, 10Y returns
- Risk: Volatility (standard deviation), Sharpe ratio, max drawdown
- Rolling returns: 3Y and 5Y rolling min/median/max
- Holdings: Top 10-20 stocks with % allocation
- Allocations: Market cap (large/mid/small), sector breakdown
- Cost: Expense ratio, AUM
Analysis:
- Holdings overlap (which funds hold the same stocks?)
- Sector concentration (are they all betting on the same sectors?)
- Expense ratio vs performance (does low cost = better returns?)
- Risk-adjusted returns (Sharpe ratio, volatility, drawdown)
- Rolling returns consistency (do they perform well in all market conditions?)
- Multi-dimensional rankings (performance, risk, value, consistency)
Limitations:
- Past performance ≠ future results
- Some funds (quant, Motilal Oswal, Sundaram, Baroda BNP) have shorter track records (<3 years)
- Holdings data is point-in-time (May 31, 2026)
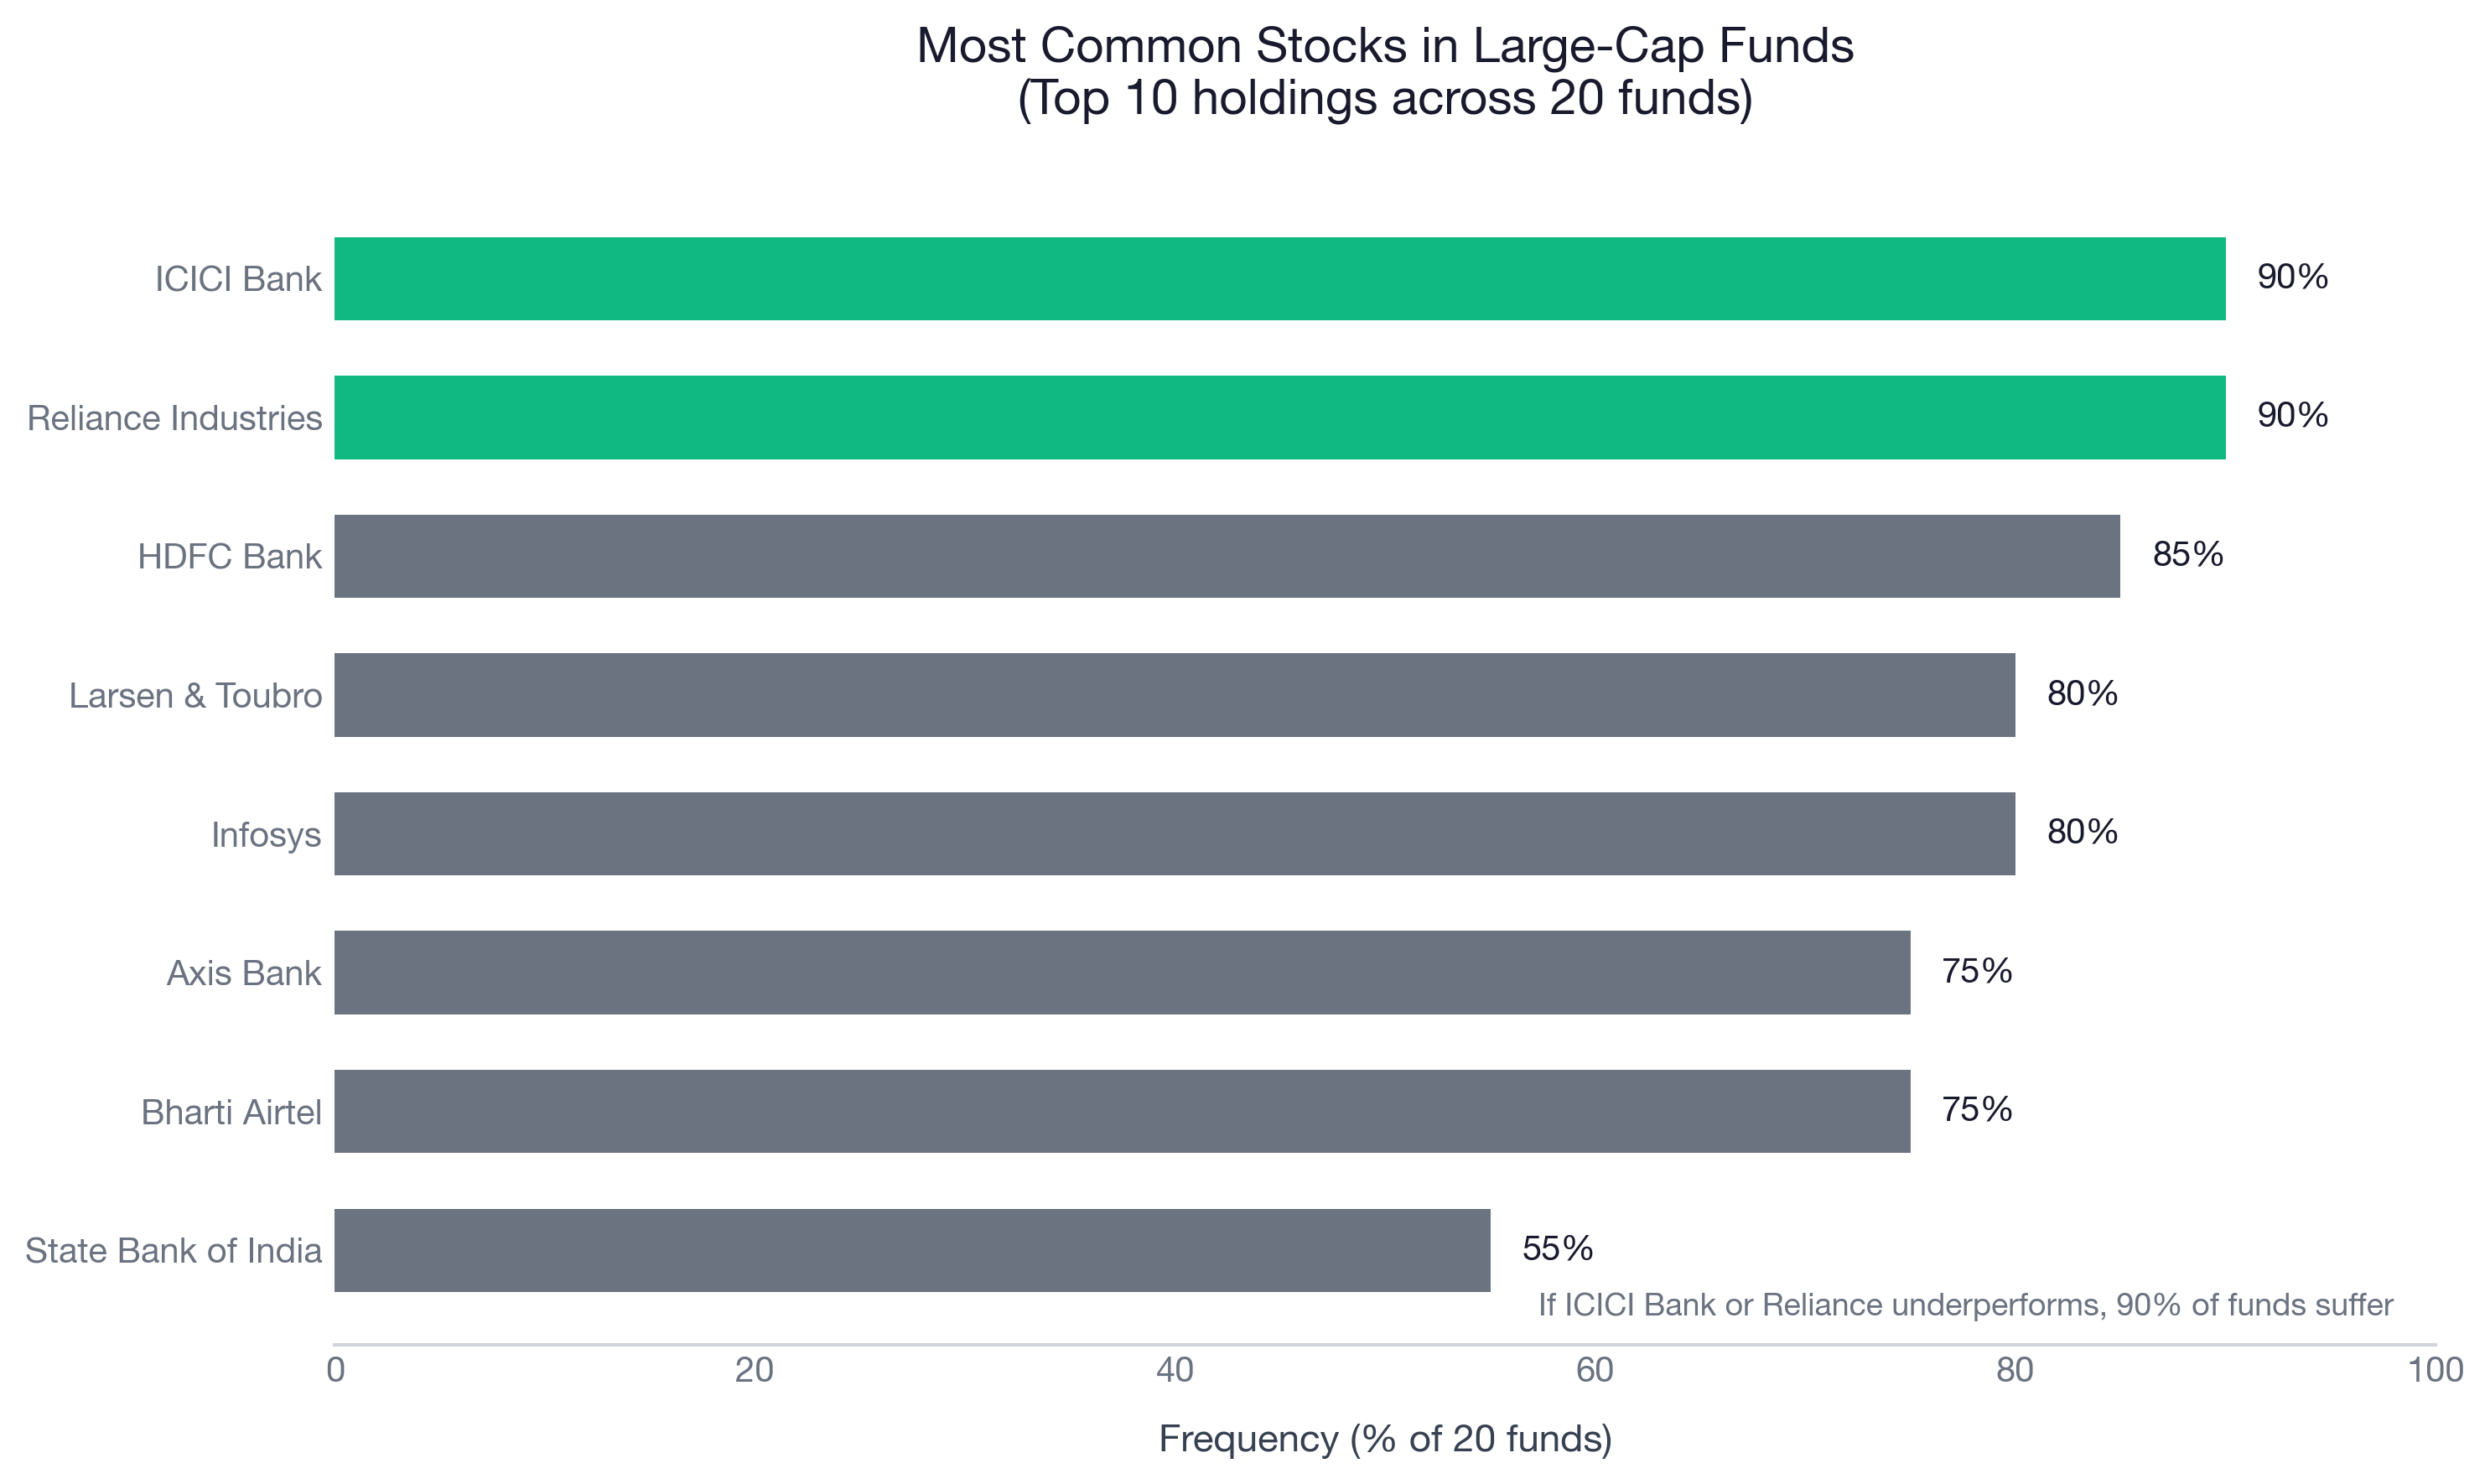
Finding #1: ICICI Bank & Reliance Dominate Everything
18 out of 20 funds hold both ICICI Bank AND Reliance Industries in their top 10 holdings.
That's 90%. HDFC Bank appears in 85%, Infosys and L&T in 80%, and Axis Bank in 75% of funds.
What this means:
If ICICI Bank or Reliance underperforms, 90% of large-cap funds will suffer. You can't escape it by picking a different fund. The top 5 stocks (ICICI, Reliance, HDFC, L&T, Infosys) are in 16-18 out of 20 funds.
This is the consensus bet across large-cap fund managers: banks (ICICI, HDFC, Axis, SBI) + energy (Reliance) + IT (Infosys) = safe large-cap portfolio.
The problem? Everyone is making the same bet. There's limited differentiation.
Finding #2: 90% Portfolio Overlap Between Fund Pairs
I compared top 10 holdings across all fund pairs. Many have 9 out of 10 stocks in common.
Funds with 9 out of 10 Same Stocks

━━━━━━━━━━━━━━━━━━━━━━━━━━━━━━━━━━━━━━━━━━━━━━━━
Fund A ↔ Fund B                    Overlap
━━━━━━━━━━━━━━━━━━━━━━━━━━━━━━━━━━━━━━━━━━━━━━━━
Mirae Asset ↔ Aditya Birla           90%
Mirae Asset ↔ Canara Robeco          90%
Axis ↔ Canara Robeco                 90%
Axis ↔ UTI                           90%
Canara Robeco ↔ Kotak                90%
Aditya Birla ↔ Franklin              90%
━━━━━━━━━━━━━━━━━━━━━━━━━━━━━━━━━━━━━━━━━━━━━━━━

Holding 2 of these = Paying 2 fund managers for the same portfolio
Even 80% overlap is common across Mirae, Axis, UTI, Kotak, DSP, and others.
What this means:
If you hold any 2 funds from the high-overlap cluster, you're paying 2 fund managers for essentially the same portfolio with zero diversification benefit.
Example: Mirae Asset (0.49% expense) + Canara Robeco (0.45% expense) = You're paying fees to 2 fund managers for 90% the same stocks.
Better strategy:
- Hold 1 large-cap fund + 1 mid-cap fund (different stocks, true diversification)
- OR hold 1 large-cap fund + 1 international fund (different geography)
Holding 2 large-cap funds only makes sense if they have <50% overlap. Not sure about your portfolio overlap? Arth analyzes your complete portfolio across mutual funds, EPF, NPS, and stocks to show hidden overlaps and recommend optimal allocation.
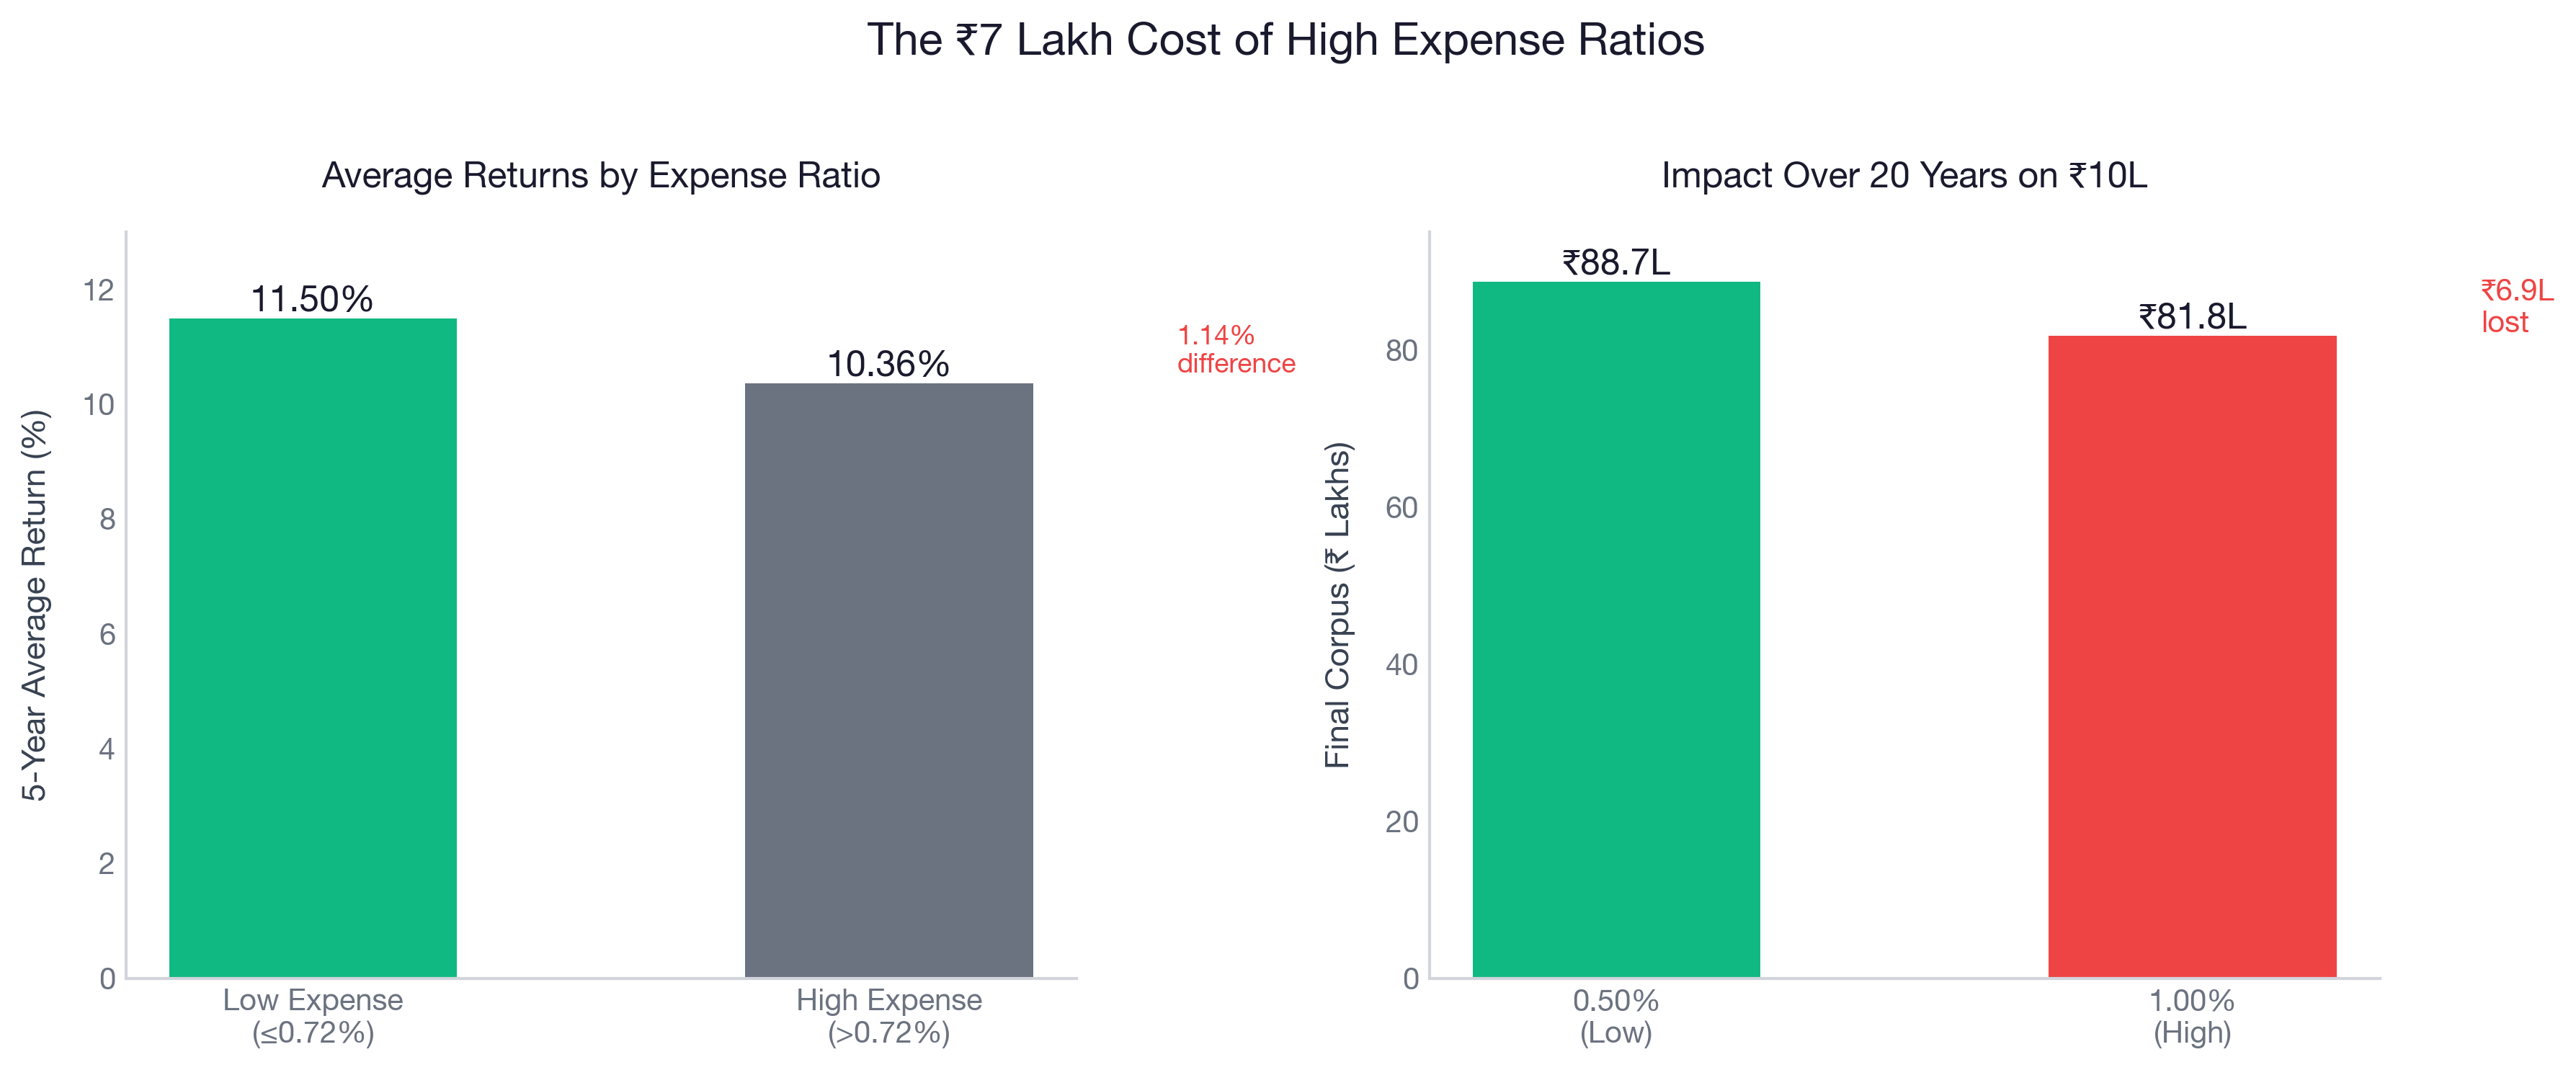
Finding #3: Lower Expense Funds Perform Better
I split funds into two groups: - Low expense: ≤0.72% (median) - High expense: >0.72%
Results:
| Expense Bucket | Avg 5Y Return | Fund Count |
|---|---|---|
| Low (≤0.72%) | 11.50% | 10 |
| High (>0.72%) | 10.36% | 10 |
Difference: 1.14 percentage points per year
Over 20 years on ₹10 lakh (assuming 11% gross returns): - 0.45% expense ratio: Final corpus ≈ ₹74.3 lakh - 1.17% expense ratio: Final corpus ≈ ₹65.2 lakh - Cost of high fees: ₹9.1 lakh
Want to see the exact impact on your portfolio? Arth's expense ratio calculator shows you how much you're losing to fees across all your investments.
Cheapest funds (0.45-0.58%): 1. Canara Robeco: 0.45% (lowest) 2. Mirae Asset: 0.49% 3. quant: 0.49% 4. Nippon India: 0.58%
Most expensive funds (0.95-1.17%): 1. UTI: 1.17% (highest) 2. HDFC: 0.98% 3. Franklin: 0.95%
Insight: In large-cap, active management doesn't justify higher fees. Most funds hold the same stocks. Paying 1.17% vs 0.45% = ₹9 lakh lost over 20 years for basically the same portfolio. According to SEBI's mutual fund classification, large-cap funds must invest at least 80% in top 100 companies, which limits differentiation.
Exception: UTI (1.17%) delivers only 8.93% (bottom 3). You're paying more for worse performance.
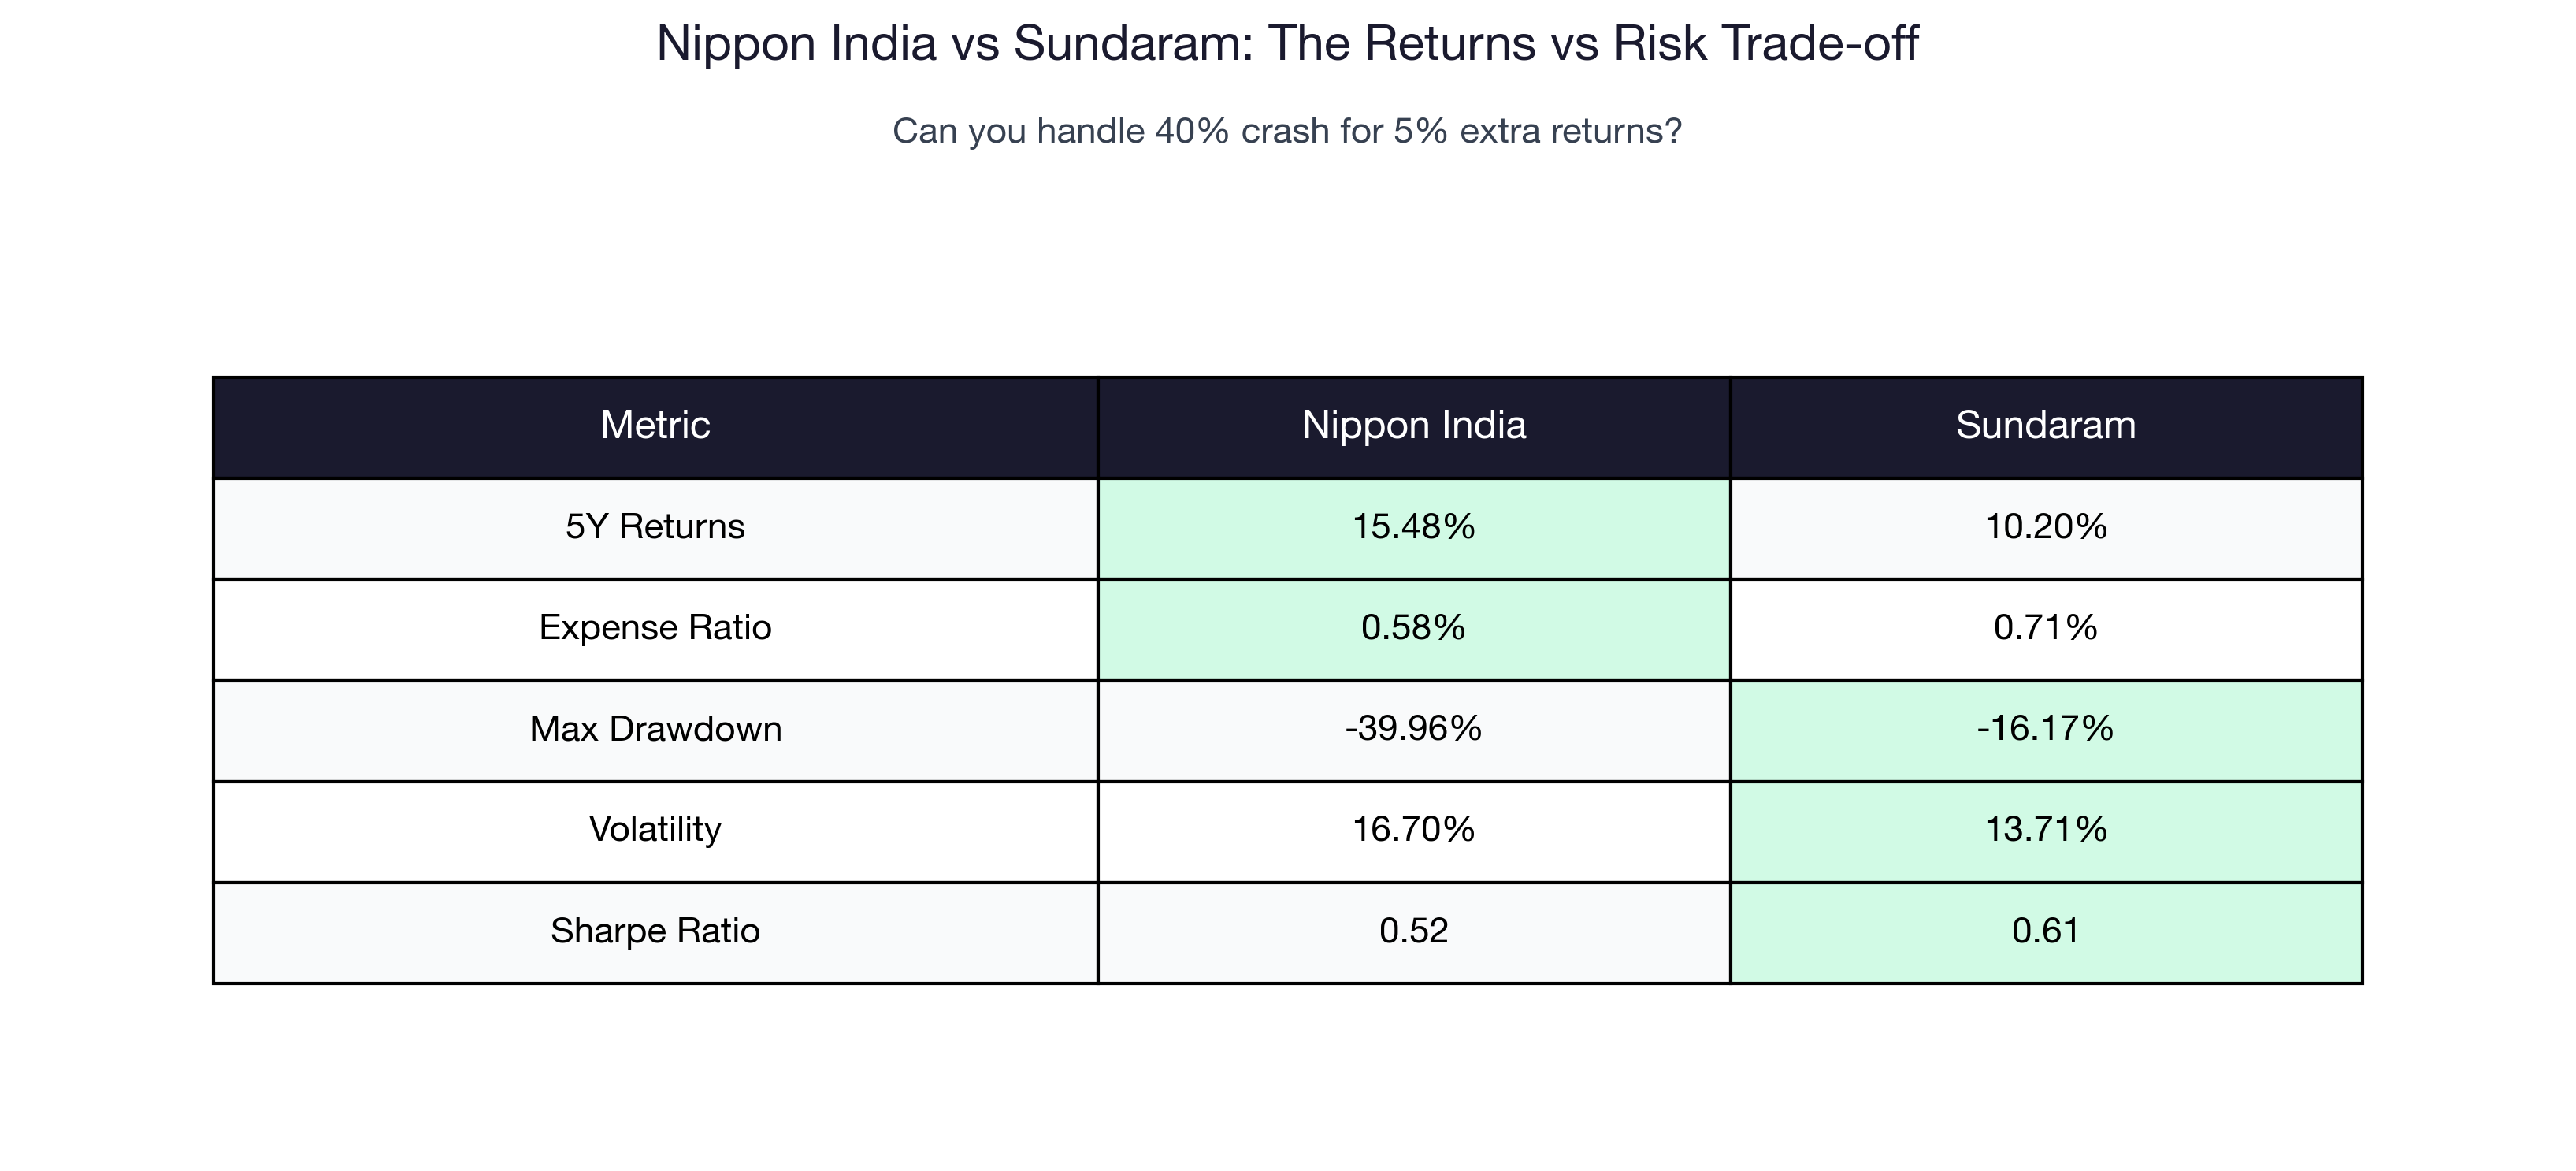
Finding #4: Higher Returns = Higher Risk (Proven)
I ranked funds by 5Y returns, then checked their risk metrics.
Top performer:
Nippon India Large Cap
- 5Y Return: 15.48% (highest)
- Expense: 0.58%
- Max Drawdown: -39.96%
- Volatility: 16.70%
- Sharpe Ratio: 0.52
Low-risk winner:
Sundaram Large Cap
- 5Y Return: 10.20% (13th rank)
- Expense: 0.71%
- Max Drawdown: -16.17% (best)
- Volatility: 13.71% (2nd lowest)
- Sharpe Ratio: 0.61 (best)
What this means:
Nippon gives you 5.28 percentage points more per year than Sundaram. But during the worst crash: - Nippon fell 40% from peak - Sundaram fell 16% from peak
The trade-off:
| Fund | 5Y Return | Max Drawdown | Can you handle this? |
|---|---|---|---|
| Nippon | 15.48% | -40% | If ₹10L becomes ₹6L during crash |
| Sundaram | 10.20% | -16% | If ₹10L becomes ₹8.4L during crash |
Your choice depends on:
- Age: 25-35 → Nippon (long runway to recover). 50+ → Sundaram (can't afford 40% crash)
- Portfolio size: ₹50L+ → Sundaram (protect capital). ₹5L → Nippon (time to recover)
- Risk tolerance: Sleep well > returns → Sundaram. Returns > volatility → Nippon
There's no free lunch. Higher returns come with bigger crashes. Pick based on what you can stomach.
Finding #5: Rolling Returns Show the Real Story
5Y returns only tell you performance from June 2021 to June 2026. But what if you invested in 2022? Or 2023? That's what rolling returns answer.
Most consistent fund (smallest 3Y rolling range):
quant Large Cap
- 3Y Rolling Min: 13.35% (best worst-case)
- 3Y Rolling Median: 16.56%
- 3Y Rolling Max: 20.26%
- Range: 6.91% (most predictable)
Even in the worst 3-year period, quant delivered 13.35%. It never gave you negative returns.
Least consistent fund (largest 3Y rolling range):
Nippon India Large Cap
- 3Y Rolling Min: -5.33% (worst case)
- 3Y Rolling Median: 17.15%
- 3Y Rolling Max: 37.01%
- Range: 42.34% (least predictable)
If you invested at the wrong time, Nippon gave you -5.33% for 3 years. If you invested at the right time, 37%.
What this means:
Nippon has the highest ceiling (37%) but the lowest floor (-5.33%). quant has a lower ceiling (20.26%) but the highest floor (13.35%).
If you're timing the market: Nippon can give you 37%. If you're NOT timing the market: quant guarantees 13%+ no matter when you enter.
Point returns hide timing luck. Rolling returns show true consistency.
Finding #6: Sector Concentration = Hidden Risk
18 out of 20 funds have Financial as their top sector.
Average sector allocations:
| Sector | Average % | What This Includes |
|---|---|---|
| Financial | 27.9% | ICICI, HDFC, Axis, SBI, Kotak |
| Energy | 9.3% | Reliance, ONGC, NTPC |
| Automobile | 7.7% | Maruti, M&M, Hero |
| Services | 7.1% | Interglobe, DMart, Trent |
| Technology | 6.2% | Infosys, TCS, Wipro |
What this means:
Most funds are ~28% banks and financials. If the banking sector underperforms (say, NPA crisis or regulatory clampdown), all large-cap funds suffer together.
This is a hidden concentration risk despite funds holding 60-80 stocks. On paper, they look diversified. In reality, they're 28% banks + 9% energy + 8% auto = 45% in just 3 sectors.
Limited differentiation across funds. Everyone is making the same sector bets.
Finding #7: Larger Funds Perform Better (Contrary to Intuition)
I split funds by AUM: - Large: >₹12,053 Cr (median) - Small: ≤₹12,053 Cr
Results:
| AUM Bucket | Avg 5Y Return | Fund Count |
|---|---|---|
| Large (>₹12k Cr) | 11.96% | 10 |
| Small (≤₹12k Cr) | 10.29% | 10 |
Difference: 1.67 percentage points per year
Why?
In mid/small-cap, smaller funds are nimble (can enter/exit fast). In large-cap, size doesn't hurt.
Large-cap stocks are liquid (ICICI, Reliance, HDFC = crores traded daily). A ₹75,000 Cr fund can buy/sell without moving the market.
Larger funds also have:
- Better processes (more analysts, risk management)
- Lower impact costs (less slippage when buying/selling)
- Proven track records (₹50k Cr AUM = investor confidence)
Insight: In large-cap, bigger = better. Don't chase small funds hoping for alpha.
The Rankings: Which Fund Wins?
I ranked all 20 funds from 5 different perspectives:
- Performance → Who has highest returns?
- Low Risk → Who protects capital best?
- Value → Who gives best returns for lowest cost?
- Risk-Adjusted → Who has best Sharpe ratio?
- Consistency → Who performs well in all conditions?
Then I calculated an average rank (composite score). Lower average rank = more well-rounded fund.
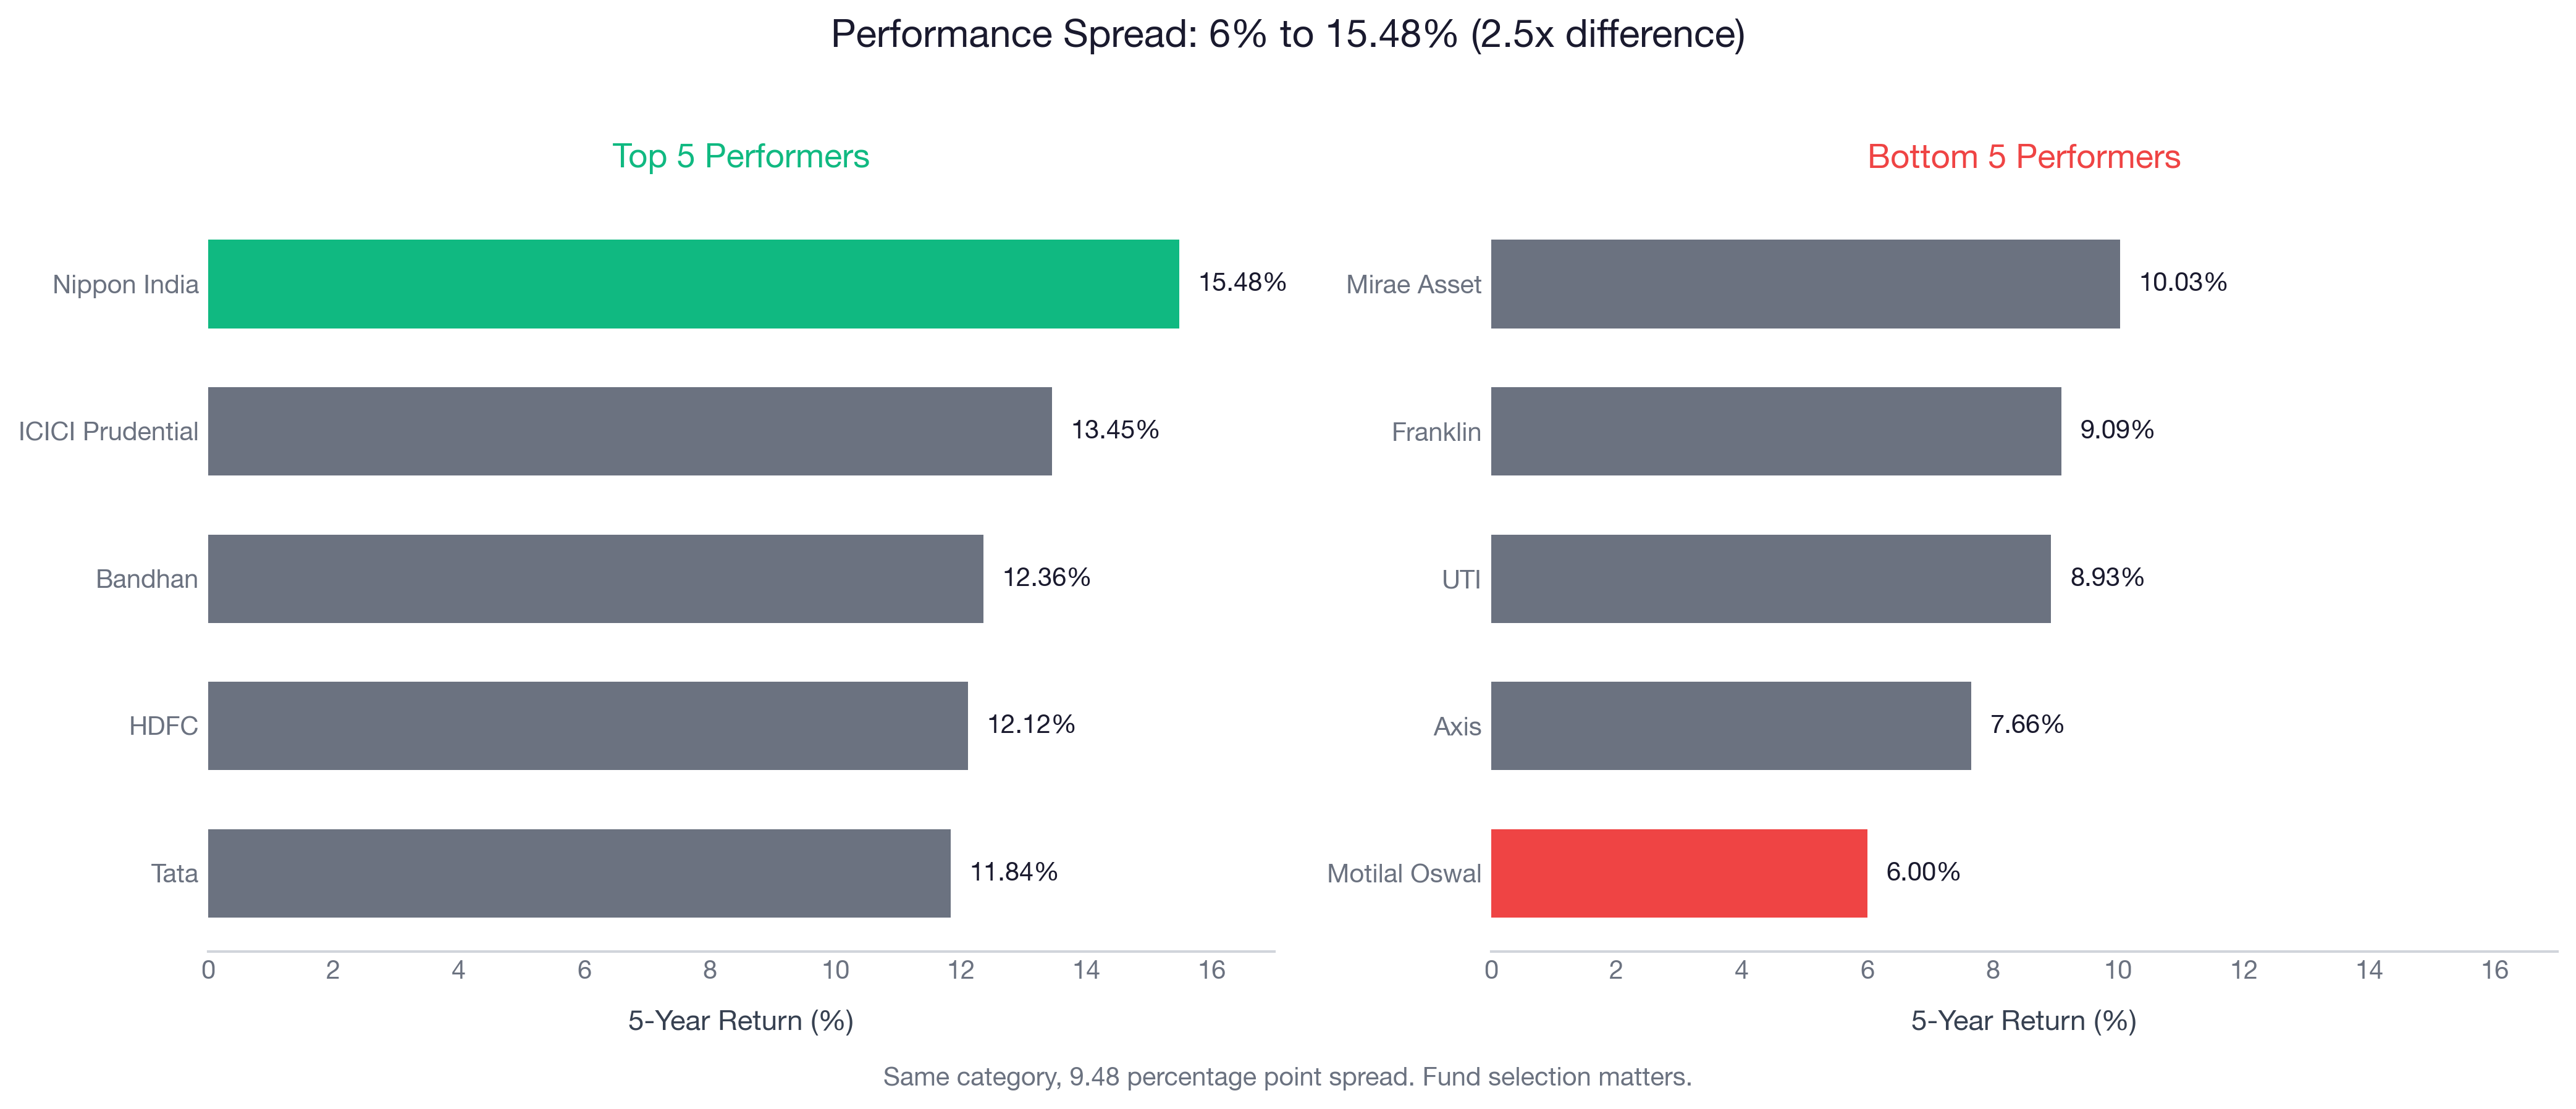
Perspective 1: Pure Performance (Returns)
| Rank | Fund | 5Y Return |
|---|---|---|
| 1 | Nippon India | 15.48% |
| 2 | ICICI Prudential | 13.45% |
| 3 | Bandhan | 12.36% |
| 4 | HDFC | 12.12% |
| 5 | Tata | 11.84% |
Winner: Nippon India (15.48%)
Perspective 2: Low Risk (Conservative Investor)
Ranked by: Lowest volatility + smallest drawdown + positive returns
| Rank | Fund | Volatility | Max Drawdown |
|---|---|---|---|
| 1 | Sundaram | 13.71% | -16.17% |
| 2 | Baroda BNP Paribas | 12.99% | -18.16% |
| 3 | quant | 15.40% | -21.11% |
| 4 | Canara Robeco | 15.32% | -32.56% |
| 5 | ICICI Prudential | 15.32% | -37.30% |
Winner: Sundaram (smoothest ride)
Perspective 3: Best Value (High Returns, Low Cost)
Ranked by: (5Y Return - 2× Expense Ratio)
| Rank | Fund | 5Y Return | Expense | Value Score |
|---|---|---|---|---|
| 1 | Nippon India | 15.48% | 0.58% | 14.32 |
| 2 | ICICI Prudential | 13.45% | 0.72% | 12.01 |
| 3 | Bandhan | 12.36% | 0.76% | 10.84 |
| 4 | Tata | 11.84% | 0.83% | 10.18 |
| 5 | Kotak | 11.45% | 0.65% | 10.15 |
Winner: Nippon India (high returns + low cost)
Perspective 4: Risk-Adjusted Excellence (Sharpe Ratio)
| Rank | Fund | Sharpe | 5Y Return | Volatility |
|---|---|---|---|---|
| 1 | Sundaram | 0.61 | 10.20% | 13.71% |
| 2 | ICICI Prudential | 0.53 | 13.45% | 15.32% |
| 3 | Mirae Asset | 0.53 | 10.03% | 15.85% |
| 4 | Nippon India | 0.52 | 15.48% | 16.70% |
Winner: Sundaram (best returns per unit of risk)
Perspective 5: Consistency Champion (Rolling Returns)
Ranked by: High 3Y rolling median + small range
| Rank | Fund | 3Y Rolling Median | 3Y Rolling Min |
|---|---|---|---|
| 1 | Nippon India | 17.15% | -5.33% |
| 2 | Baroda BNP Paribas | 17.26% | 13.16% |
| 3 | ICICI Prudential | 16.60% | -4.82% |
| 4 | Mirae Asset | 16.02% | -2.81% |
Winner: Nippon India (highest median)
BUT Baroda BNP Paribas has the best floor (13.16% worst-case vs -5.33%)
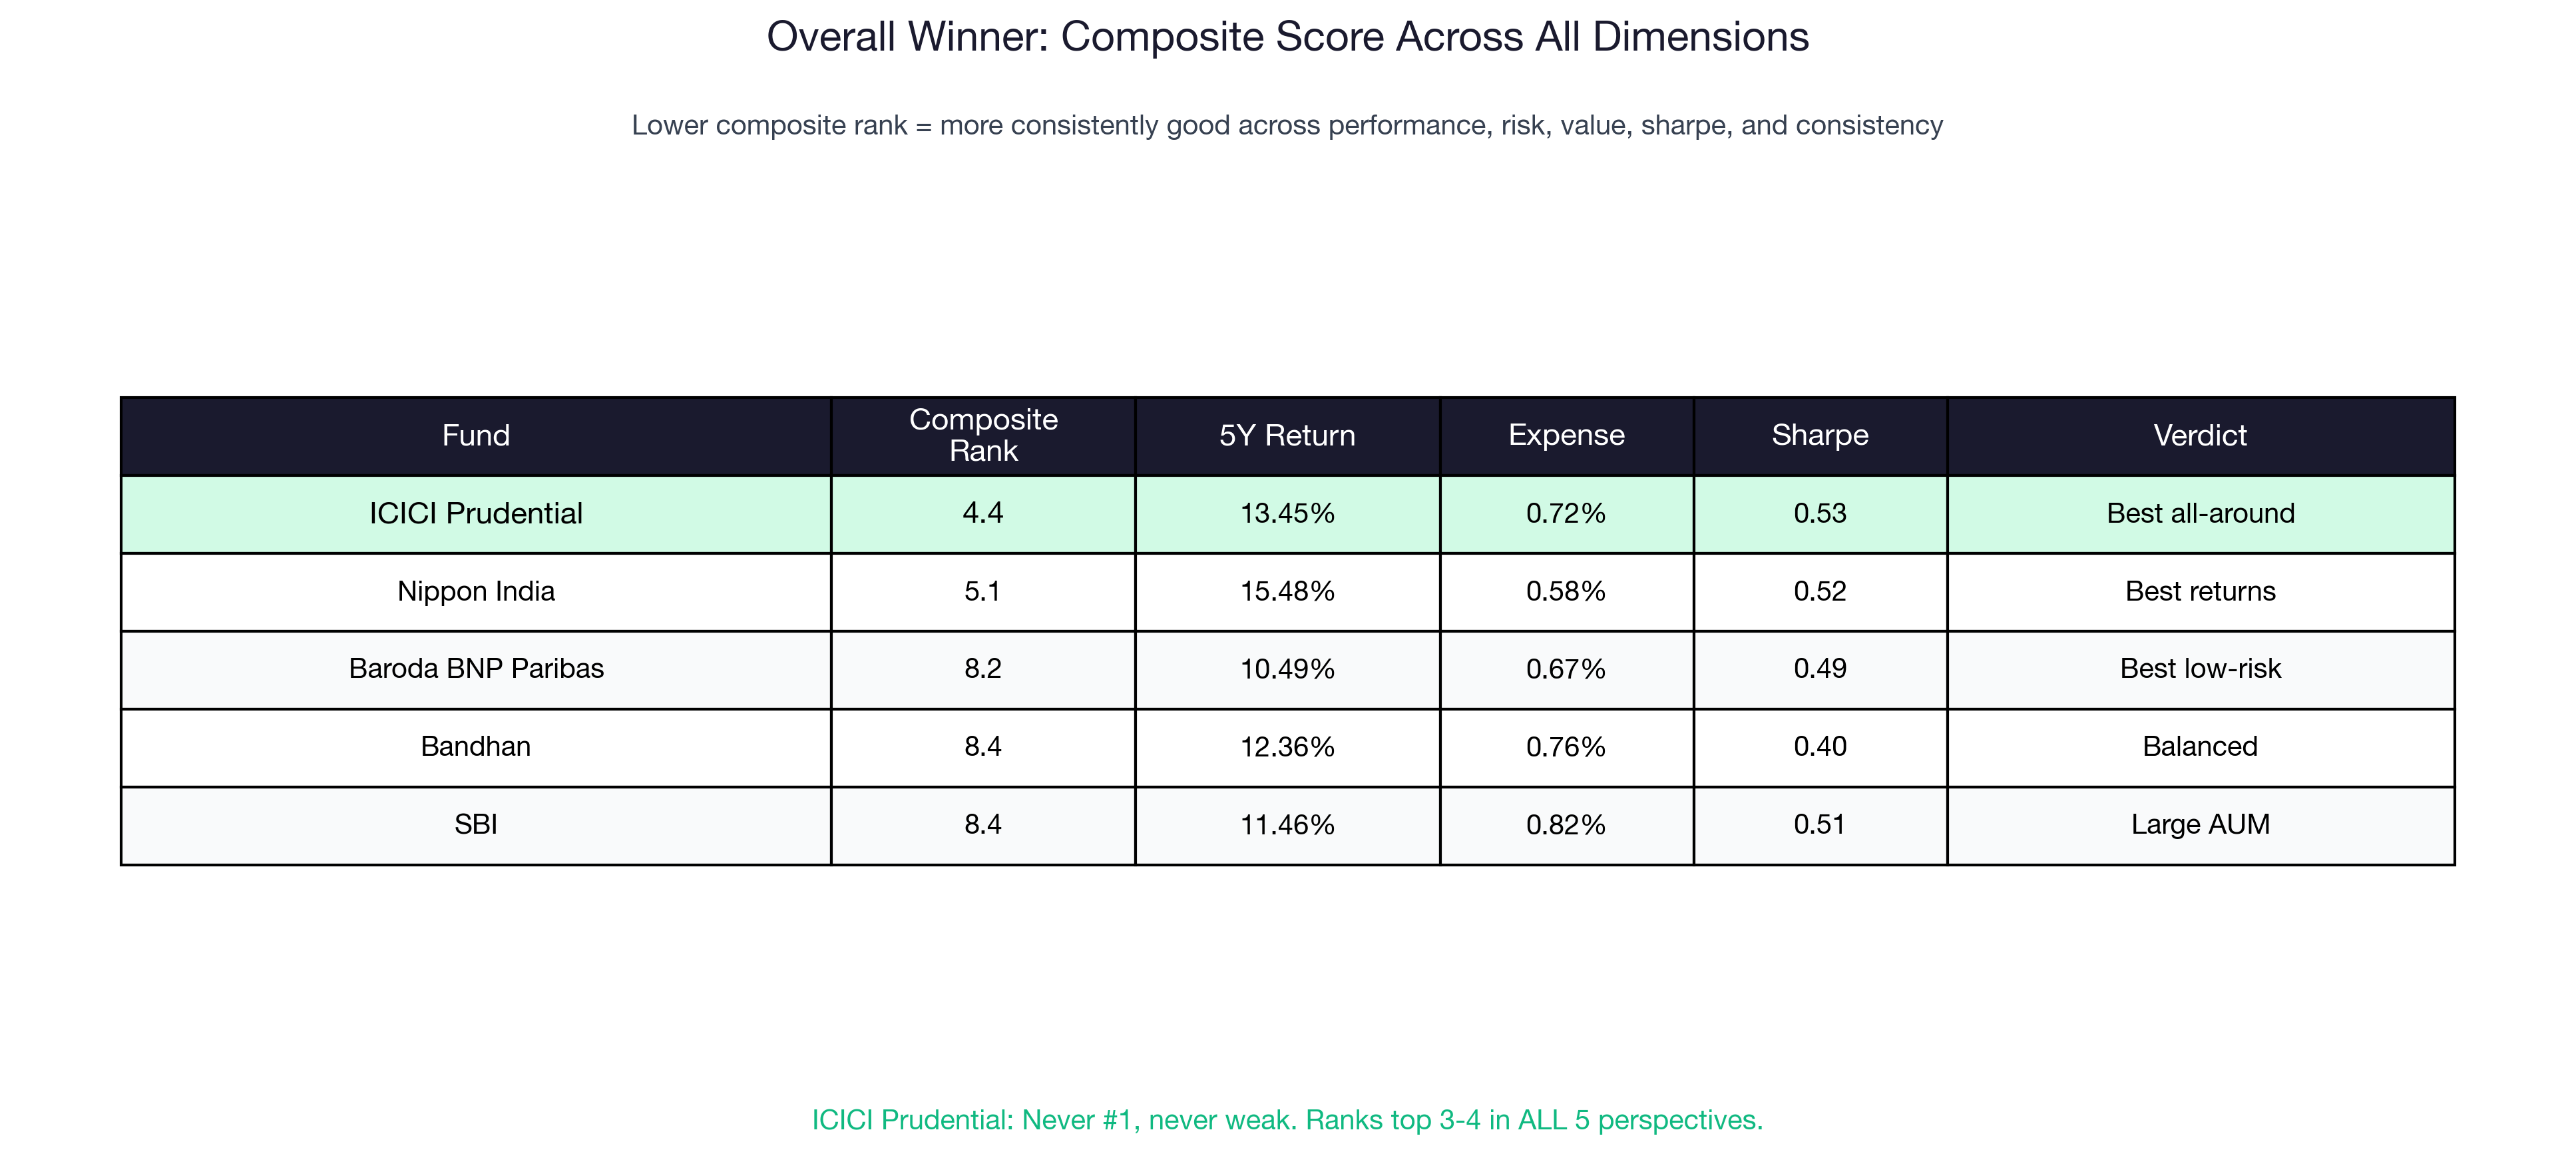
The Overall Winner: Composite Score
Methodology: Average rank across all 5 perspectives
| Rank | Fund | Avg Rank | 5Y Return | Expense | Sharpe |
|---|---|---|---|---|---|
| 1 | ICICI Prudential | 4.4 | 13.45% | 0.72% | 0.53 |
| 2 | Nippon India | 5.1 | 15.48% | 0.58% | 0.52 |
| 3 | Baroda BNP Paribas | 8.2 | 10.49% | 0.67% | 0.49 |
| 4 | Bandhan | 8.4 | 12.36% | 0.76% | 0.40 |
| 5 | SBI | 8.4 | 11.46% | 0.82% | 0.51 |
Why ICICI Prudential Wins Overall
ICICI Prudential ranks in the top 3-4 across ALL dimensions. It's never #1, but it's never weak.
Ranks:
- Performance: #3 (13.45%)
- Low Risk: #10 (not the safest, but not risky)
- Value: #3 (good returns for reasonable cost)
- Risk-Adjusted: #3 (0.53 Sharpe)
- Consistency: #3 (16.60% 3Y rolling median)
Nippon India vs ICICI Prudential:
| Metric | Nippon India | ICICI Prudential | Winner |
|---|---|---|---|
| 5Y Returns | 15.48% ✅ | 13.45% | Nippon |
| Expense Ratio | 0.58% ✅ | 0.72% | Nippon |
| Sharpe Ratio | 0.52 | 0.53 ✅ | ICICI |
| Max Drawdown | -39.96% | -37.30% ✅ | ICICI |
| Volatility | 16.70% | 15.32% ✅ | ICICI |
| Consistency (3Y min) | -5.33% | -4.82% ✅ | ICICI |
| Composite Rank | 5.1 | 4.4 ✅ | ICICI |
Verdict:
- Nippon = Best for aggressive investors chasing maximum returns
- ICICI Prudential = Best all-rounder for balanced risk/return
My Recommendations (By Investor Profile)
For Maximum Returns (Aggressive)
Pick: Nippon India Large Cap
- 5Y Return: 15.48% (highest)
- Expense: 0.58% (reasonable)
- Max Drawdown: -39.96% (can you handle this?)
Who it's for:
- Age 25-35 (long runway to recover from crashes)
- Portfolio <₹10L (small enough to rebuild)
- High risk tolerance (won't panic-sell during 40% crash)
For Balanced Risk/Return
Pick: ICICI Prudential Large Cap
- 5Y Return: 13.45% (2nd highest)
- Expense: 0.72% (median)
- Sharpe: 0.53 (good risk-adjusted returns)
- Composite Rank: 4.4 (best all-around)
Who it's for:
- Age 35-50 (growth + safety balance)
- Portfolio ₹10-50L (meaningful corpus to protect)
- Moderate risk tolerance (can handle 35% crash)
This is the safest pick if you can only choose one.
For Low Risk (Conservative)
Pick: Sundaram Large Cap
- 5Y Return: 10.20% (lower than top performers)
- Expense: 0.71%
- Max Drawdown: -16.17% (best downside protection)
- Sharpe: 0.61 (best risk-adjusted)
Who it's for:
- Age 50+ (can't afford big crashes)
- Portfolio >₹50L (capital preservation matters)
- Low risk tolerance (want to sleep well)
Alternative: Baroda BNP Paribas (lowest volatility 12.99%)
For Lowest Cost (Value Seeker)
Pick: Canara Robeco Large Cap
- Expense: 0.45% (cheapest)
- 5Y Return: 10.91%
- Large-cap purity: 89.6%
Who it's for:
- Long-term investors (20+ years)
- Cost-conscious (every 0.1% matters)
- Index-like exposure with slight active management
Over 20 years, you'll save ₹9 lakh vs UTI (1.17%).
For Consistency (Predictable Returns)
Pick: quant Large Cap
- 3Y Rolling Min: 13.35% (highest floor)
- 3Y Rolling Range: 6.91% (most consistent)
- Never gave negative 3Y returns
Who it's for:
- SIP investors (don't time the market)
- Risk-averse (want predictable outcomes)
- Short track record (launched 2022), but data is promising
What to Avoid
UTI Large Cap
- Expense: 1.17% (highest)
- 5Y Return: 8.93% (bottom 3)
- You're paying more for worse performance
Kotak Large Cap (IDCW option)
- 3Y Rolling Min: -12.97% (worst case)
- 3Y Rolling Range: 45.56% (most unpredictable)
- Extreme volatility
Holding 2+ Large-Cap Funds
- 90% overlap = paying 2 fund managers for the same stocks
- Better: 1 large-cap + 1 mid-cap OR 1 large-cap + 1 international
My Choice
If I had to pick one large-cap fund today, I'd go with ICICI Prudential Large Cap.
Why?
- 13.45% returns (2nd highest)
- 0.72% expense (median, not cheapest but reasonable)
- 0.53 Sharpe (good risk-adjusted)
- Ranks top 3-4 in ALL categories (no weak spots)
- ₹75,650 Cr AUM (scale + proven track record)
It's not #1 in any single dimension, but it's never weak. That consistency across all metrics makes it the safest pick.
If I were more aggressive (25-35 age, <₹10L portfolio), I'd pick Nippon India (15.48%) and accept the -40% crash risk.
If I were conservative (50+ age, >₹50L portfolio), I'd pick Sundaram (10.20%, -16% crash, 0.61 Sharpe).
Conclusion
After analyzing 20 large-cap funds, here's what matters:
- 90% hold the same stocks → Holding 2 large-cap funds = paying 2 managers for the same portfolio with no diversification
- Low expense wins → ₹9L saved over 20 years by choosing 0.45% vs 1.17%
- ICICI Prudential wins overall → Most balanced fund across all dimensions
Not sure which fund fits your portfolio? Analyze your complete portfolio with Arth, we'll show you overlap, hidden costs, and better alternatives across all your investments (EPF, NPS, MFs, stocks).
Disclaimer: This is educational content, not investment advice. Past performance is not indicative of future results. Do your own research or consult a SEBI-registered investment advisor before investing.
Run these numbers on your finances
Arth looks at your full picture and tells you what actually matters.
Try Arth →