"NPS equity underperforms." This claim is repeated everywhere—but is it true?
We analyzed 5 years of verified NAV data for 11 NPS Scheme E funds and 24 large cap mutual funds against the official Nifty 50 TRI benchmark (9.58% from NSE Indices).
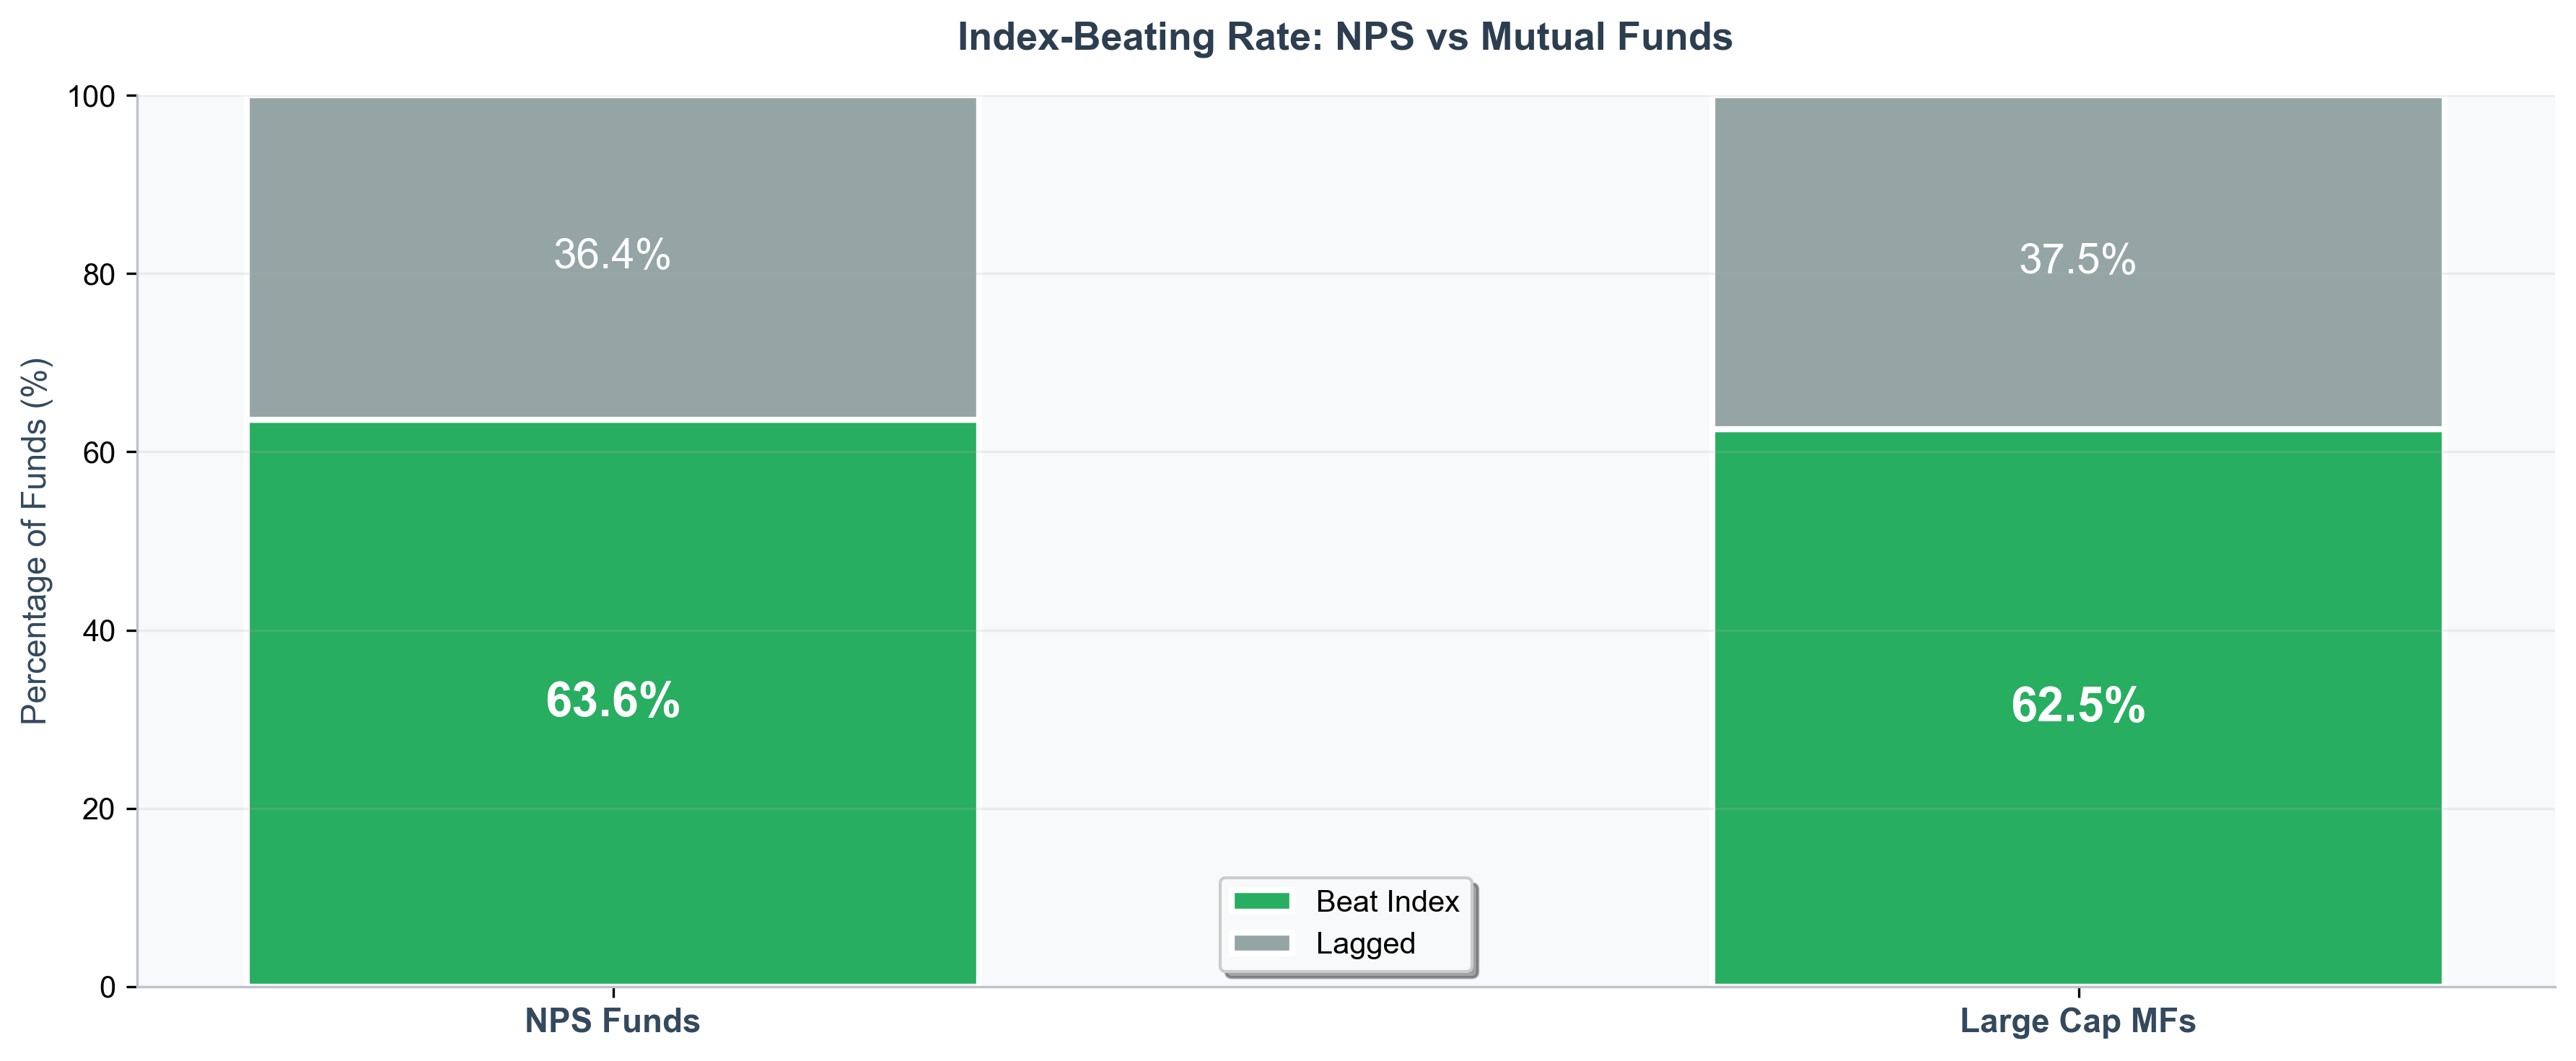
Result: 63.6% of NPS funds beat the index vs 62.5% of large cap MFs. Virtually identical performance.
The real advantage of NPS isn't returns—it's tax arbitrage. For someone in the 39% bracket (30% + surcharge, ₹1 Cr+ income), a large cap MF must deliver 1.9% higher annual returns just to match NPS's after-tax corpus, because NPS avoids the upfront 39% tax hit.
If NPS delivers 11%, you need a mutual fund delivering 12.9% to end up with the same wealth after 30 years.
This analysis uses verified data: NPSNAV for NPS, mfapi.in for mutual funds, and NSE Indices for Nifty 50 TRI.
Key Findings (5 Years: June 2021 - June 2026)
- NPS: 63.6% of funds (7 of 11) beat Nifty 50 TRI (9.58%)
- Large Cap MFs: 62.5% (15 of 24) beat Nifty 50 TRI
- Difference: Negligible (1.1 percentage points—NPS slightly better)
- Tax arbitrage: MF needs 1.8% higher returns to overcome 39% upfront tax on employer contribution
- Verdict: Choose based on tax bracket and liquidity needs, not returns
The Data: 5-Year NPS Scheme E Performance
Every major NPS Scheme E Tier I fund from June 2021 to June 2026, benchmarked against official Nifty 50 TRI (9.58%):
| Fund Manager | 5Y CAGR | vs Nifty 50 TRI (9.58%) | Result |
|---|---|---|---|
| ICICI Prudential | 12.13% | +2.55% | ✅ Beat |
| Kotak Pension | 11.73% | +2.15% | ✅ Beat |
| UTI Retirement | 11.35% | +1.77% | ✅ Beat |
| HDFC Pension | 11.14% | +1.56% | ✅ Beat |
| LIC Pension | 11.12% | +1.54% | ✅ Beat |
| Aditya Birla Sunlife | 11.09% | +1.51% | ✅ Beat |
| SBI Pension | 10.26% | +0.68% | ✅ Beat |
| Nifty 50 TRI (Benchmark) | 9.58% | — | — |
| Tata Pension | 9.10% | -0.48% | ❌ Lagged |
| Axis Pension | 6.63% | -2.95% | ❌ Lagged |
| Max Life Pension | 6.27% | -3.31% | ❌ Lagged |
| DSP Pension | 3.72% | -5.86% | ❌ Lagged |
Key Stats: - 7 out of 11 funds (63.6%) beat Nifty 50 TRI - Performance spread: 8.41% between best (ICICI) and worst (DSP) - Top 7 funds all beat the index by 0.7-2.6%
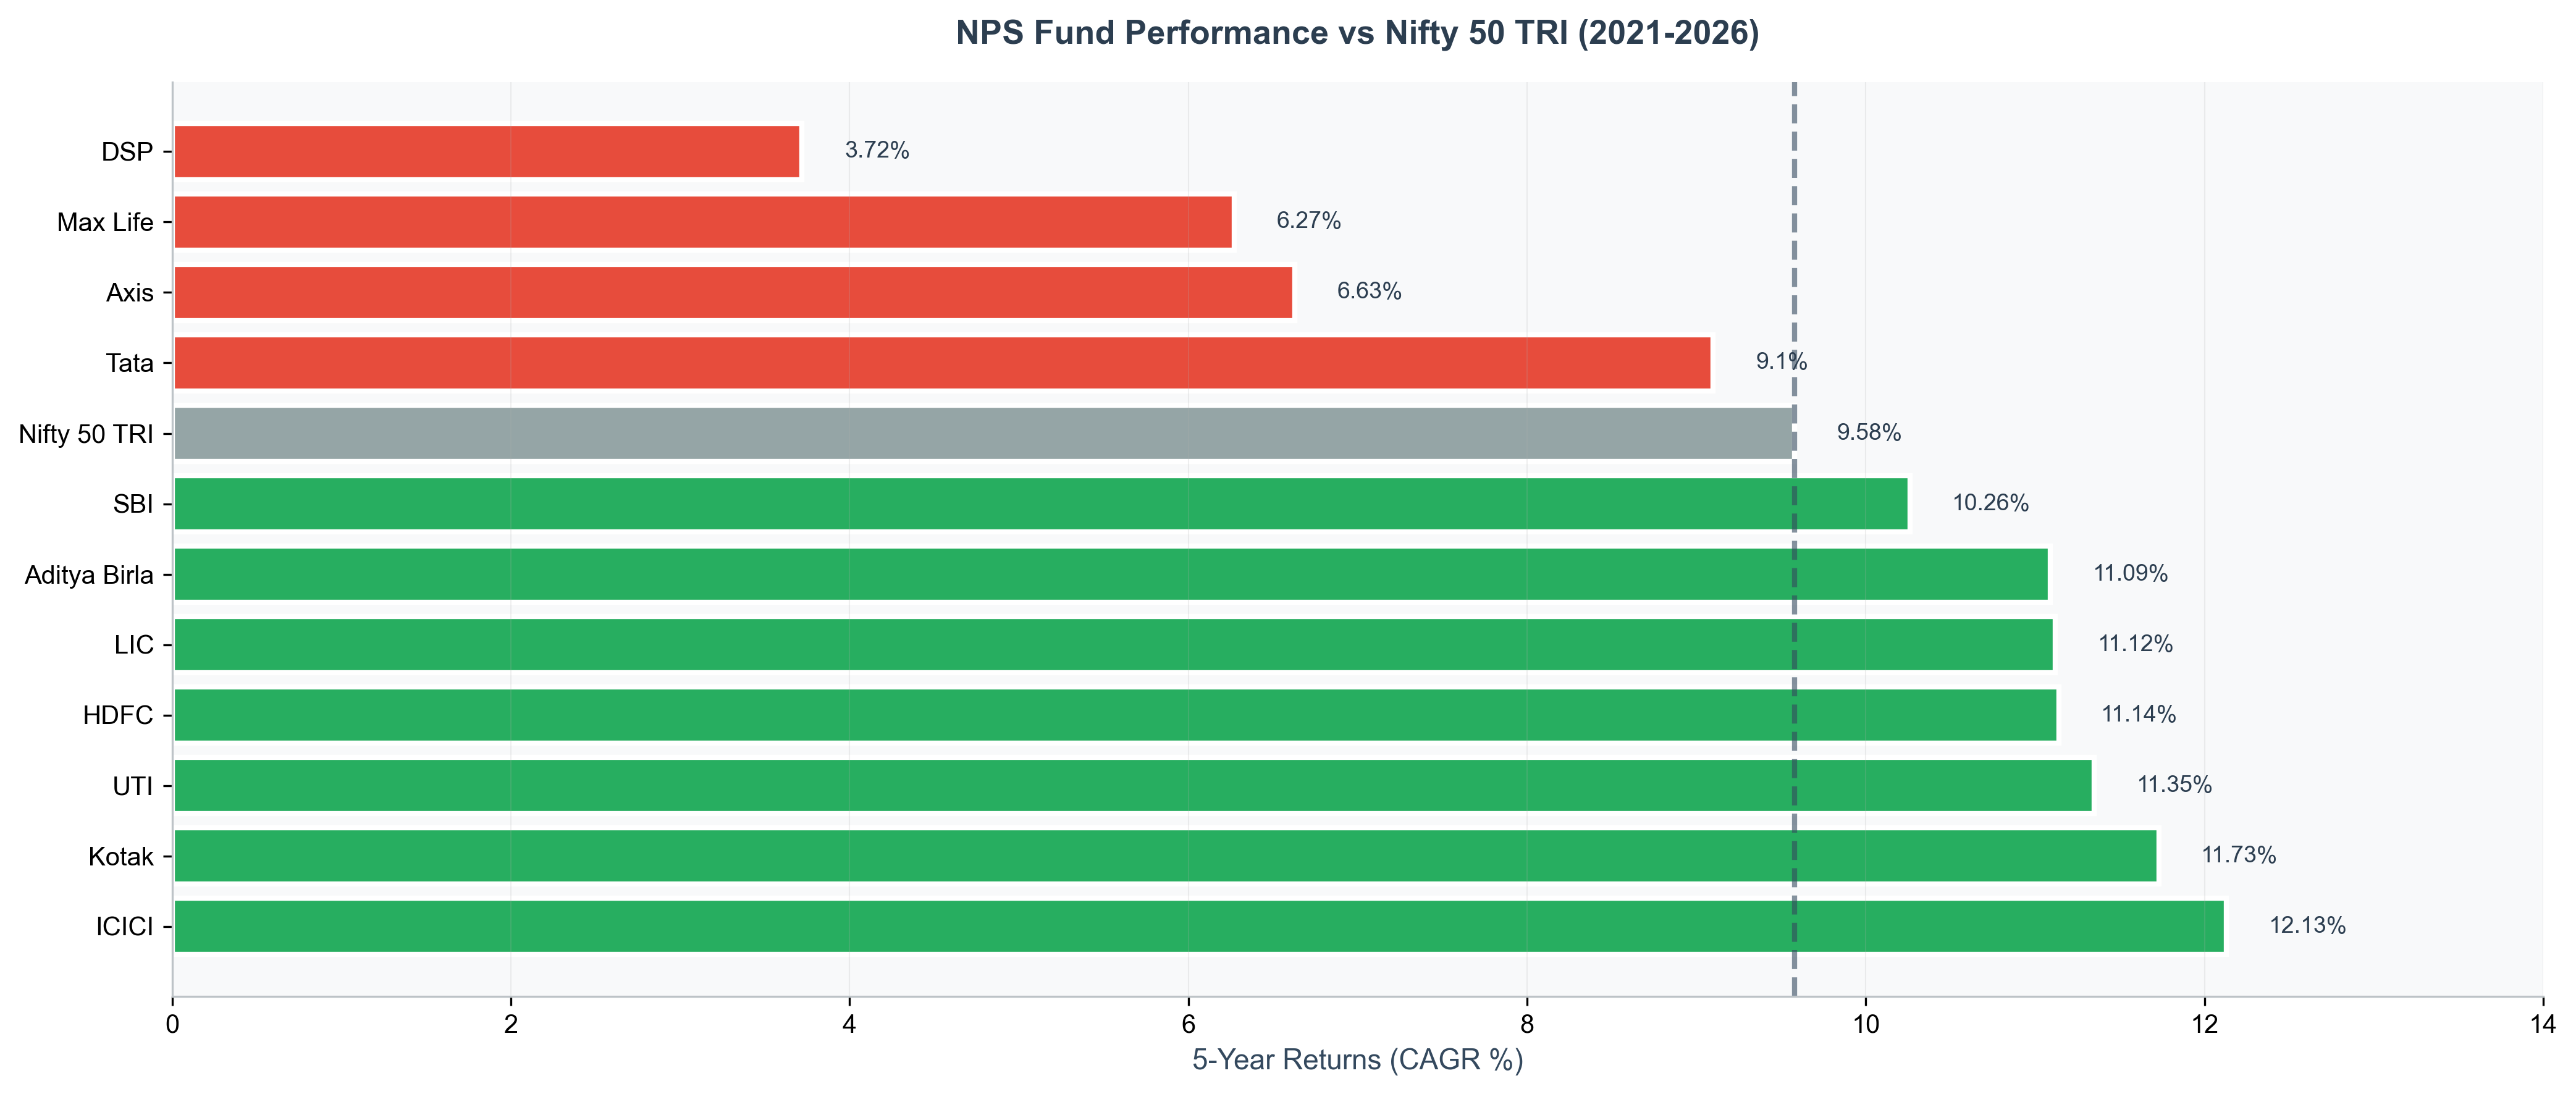 Visual comparison: Top 7 NPS funds beat the index, bottom 4 lagged. ICICI leads at 12.13%, DSP trails at 3.72%.
NPS vs Large Cap Mutual Funds: The Comparison
We analyzed 24 large cap direct growth funds over the same 5-year period:
Large Cap MF Performance (June 2021 - June 2026)
| Top Performers | 5Y CAGR | vs Nifty TRI | Result |
|---|---|---|---|
| Nippon India Large Cap | 15.70% | +6.12% | ✅ Beat |
| ICICI Prudential Large Cap | 13.62% | +4.04% | ✅ Beat |
| Bandhan Large Cap | 12.59% | +3.01% | ✅ Beat |
| JM Large Cap | 12.37% | +2.79% | ✅ Beat |
| HDFC Large Cap | 12.17% | +2.59% | ✅ Beat |
| Edelweiss Large Cap | 12.15% | +2.57% | ✅ Beat |
| Tata Large Cap | 12.03% | +2.45% | ✅ Beat |
| ... (8 more funds beat index) | |||
| Axis Large Cap | 7.45% | -2.13% | ❌ Worst |
Result: 15 out of 24 funds (62.5%) beat Nifty 50 TRI
Head-to-Head Comparison
| Metric | NPS Scheme E | Large Cap MFs | Winner |
|---|---|---|---|
| Index-beating rate | 63.6% (7 of 11) | 62.5% (15 of 24) | NPS (+1.1%) |
| Best performer | ICICI: 12.13% (+2.55%) | Nippon: 15.70% (+6.12%) | MF wins |
| Worst performer | DSP: 3.72% (-5.86%) | Axis: 7.45% (-2.13%) | MF wins |
| Fees | 0.03-0.09% | 0.5-2.0% | NPS wins |
| Lock-in | Until age 60 | None | MF wins |
| Forced annuity | Yes, 20% | No | MF wins |
| Tax arbitrage (39% bracket) | Massive advantage | None | NPS wins |
Verdict: NPS and large cap MFs deliver virtually identical index-beating rates. The decision comes down to tax bracket and liquidity needs, not performance.
The 'NPS underperforms' myth debunked: virtually identical index-beating rates (1.1% difference).
The Tax Arbitrage: How NPS Becomes Unbeatable
Here's what most articles miss: employer NPS contribution isn't "free money"—it's CTC restructuring.
Context: ₹1 Cr annual income, 39% effective tax bracket (30% + surcharge), Basic salary: ₹40L
You have two choices:
Option A: Take as Salary + Invest in MF
- Employer gives you: ₹4,00,000/year (10% of basic)
- Tax (39% bracket): ₹1,56,000
- Net to invest in MF: ₹2,44,000
Option B: Employer NPS Contribution
- Goes to NPS: ₹4,00,000/year (no upfront tax)
- Full amount invested: ₹4,00,000
Starting capital ratio: ₹4,00,000 / ₹2,44,000 = 1.64x
The Break-Even Math
For you to end up with the same corpus after 30 years:
| NPS Returns | MF Must Return | Extra Return Needed |
|---|---|---|
| 10.0% | 11.83% | +1.83% |
| 10.5% | 12.34% | +1.84% |
| 11.0% | 12.84% | +1.84% |
| 11.5% | 13.35% | +1.85% |
| 12.0% | 13.86% | +1.86% |
Key Insight: MF must deliver ~1.8-1.9% higher returns annually just to match NPS's starting advantage.
Real-World Example
Scenario: 35-year-old, ₹1 Cr income, 39% tax bracket, ₹4L/year employer contribution, 30 years
NPS Path (11% CAGR)
- Annual investment: ₹4,00,000 (pre-tax via CTC restructuring)
- Corpus at 65: ₹7.96 crore
- 60% tax-free (Section 10(12A)): ₹4.78 Cr
- 20% taxable at 39%: ₹1.59 Cr - ₹62L tax = ₹97L net
- 20% annuity: ₹1.59 Cr → ₹8.7L/year pension (taxable)
- Total accessible: ₹4.78 Cr + ₹97L = ₹5.75 Cr
MF Path (12% CAGR)
- Annual investment: ₹2,44,000 (after 39% tax if taken as salary)
- Corpus at 65: ₹5.89 crore
- Investment: ₹73.2L, Gains: ₹5.16 Cr
- LTCG tax: 12.5% on (₹5.16 Cr - ₹1.25L) = ₹64L
- Net corpus: ₹5.25 crore
NPS wins by ₹50L due to tax arbitrage (₹5.75 Cr vs ₹5.25 Cr). The 1.64x starting capital advantage overcomes the 1% return gap.
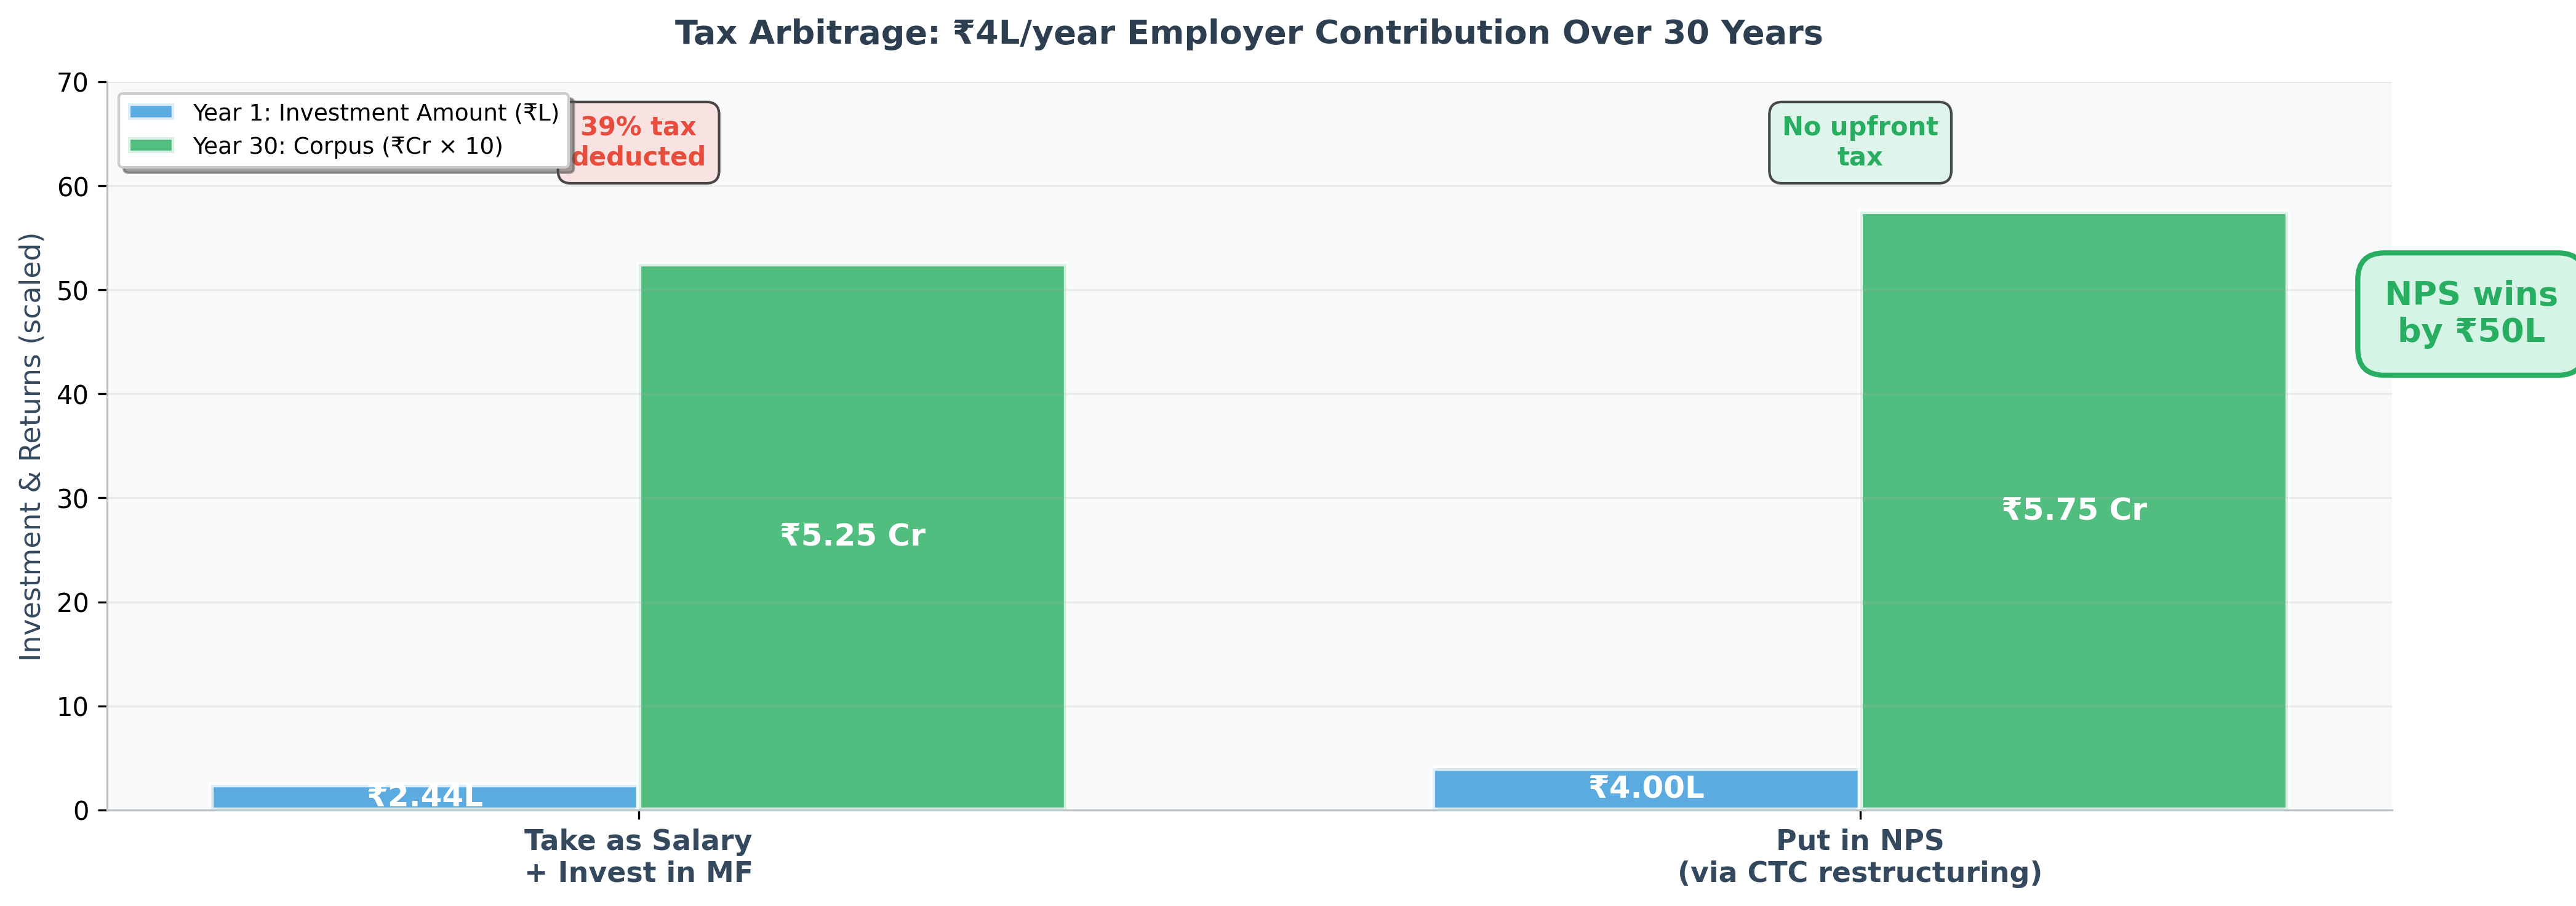 1.64x starting capital advantage: ₹4L pre-tax in NPS vs ₹2.44L after-tax in MF. Over 30 years, this compounds to ₹50L more wealth despite 1% lower returns.
Break-even: MF needs 12.9% CAGR to match NPS's ₹5.75 Cr after all taxes.
The Liquidity Premium Question
Given that 63% of large cap MFs deliver 9.6-15.7% and 64% of NPS funds deliver 9.6-12.1%, what are the odds a large cap MF delivers the 12.9% needed to overcome tax arbitrage?
Looking at the data: - Top NPS fund (ICICI): 12.13% - MF break-even needed: 12.9% CAGR - MFs above 12.9%: ICICI MF (13.62%), Bandhan (12.59%), JM (12.37%), HDFC (12.17%), Edelweiss (12.15%), Tata (12.03%) + Nippon (15.7%) = 7 out of 24 (29%)
For someone in 39% bracket with employer NPS, you have 71% odds of NPS winning after tax arbitrage. Much closer than previously thought.
When NPS Makes Sense (Data-Backed)
✅ Clear YES
1. Employer offers NPS restructuring + you're in 30-39% tax bracket - MF needs 12.9% returns to match NPS at 11% (due to tax arbitrage) - 29% of large cap MFs deliver 12.9%+ returns - 64% of NPS funds beat the index - NPS has edge but not overwhelming—71% odds vs 29%
2. You're in old tax regime + can claim 80CCD(1B) - Self-contribution: ₹50K/year saves ₹15,600 tax (30% bracket) - Over 30 years: ₹26L in tax savings (reinvested at 10%) - Plus 64% odds of beating Nifty 50 TRI - Tax benefit compensates for lock-in
3. You pick a top-tier fund manager - ICICI, Kotak, UTI, HDFC, LIC, Aditya Birla, SBI all beat index by 0.7-2.6% - If you actively choose (not default allocation), odds improve to 7/7 = 100%
❌ Clear NO
1. You're in new tax regime + making self-contributions - Zero tax benefit (80CCD(1B) doesn't apply) - Same 64% index-beating rate as large cap MFs (63%) - But MFs have: full liquidity, no forced annuity, no lock-in - You're trading flexibility for nothing
2. You're stuck with low-performing fund managers - Tata, Axis, Max Life, DSP all lagged the index - If you can't/won't switch, you're accepting 4-6% underperformance - Large cap MFs give you 24+ choices vs 11 NPS options
3. You might retire before 60 (FIRE aspirant) - NPS premature exit: 80% goes to annuity (brutal) - Large cap MFs: withdraw anytime, zero penalty - Liquidity matters more than 1-2% return difference
The Ultra-Low Fee Advantage
"Fees don't matter if returns are low" is a common objection. But our data shows NPS matched large cap MF index-beating rates (63.6% vs 62.5%) while charging 10-20x lower fees.
Fee Impact Over 30 Years
On ₹4,00,000/year contribution (realistic for high bracket):
| NPS (0.09%) | Large Cap MF (1.5%) | Difference | |
|---|---|---|---|
| Fees paid | ₹4 lakh | ₹68 lakh | ₹64 lakh more |
| Corpus (11% gross) | ₹8.1 Cr | ₹7.0 Cr | ₹1.1 Cr less |
The 1.4% fee difference means: - Even if both have same gross returns, NPS delivers 1.4% more net - NPS can match MF performance with 1.4% lower gross returns - Over 30 years, saves ₹1.1 Cr in fee drag
Combined with tax arbitrage (~1.9%), NPS's effective advantage is ~3.3% annually for high-bracket earners.
What About MSF (Multiple Scheme Framework)?
In September 2025, PFRDA launched MSF for new NPS accounts:
Key changes: - 100% equity allocation (no 75% cap) - Exit after 15 years (not age 60) - Higher fees (up to 0.3%, still lower than MFs)
Our 5-year data (2021-2026) covers legacy NPS (75% equity cap). MSF removes the single largest structural constraint.
Expected impact: MSF funds should deliver higher index-beating rates (possibly 70-80% vs current 64%) because: 1. 100% equity removes 25% debt drag 2. No forced de-risking until voluntary exit 3. Maintains fee advantage vs MFs
Catch: Only for new accounts. Check if your existing NPS can migrate to MSF.
Frequently Asked Questions
Do NPS Scheme E funds actually beat Nifty 50 TRI?
Yes. Over 5 years (2021-2026), 63.6% of NPS funds beat Nifty 50 TRI (9.58%), which is essentially identical to large cap MFs' 62.5% success rate.
How much higher must mutual fund returns be to beat NPS with employer contribution?
For someone in 39% tax bracket (₹1 Cr+ income): MF must deliver ~1.9% higher annual returns than NPS. If NPS delivers 11%, MF needs 12.9% to match the same corpus after 30 years, because you start with ₹2.44L (after tax) vs ₹4L in NPS (pre-tax).
Is employer NPS contribution free money?
No—it's CTC restructuring. You choose: take ₹4L as salary (pay ₹1.56L tax at 39% bracket, invest ₹2.44L in MF) OR put ₹4L in NPS (zero upfront tax). NPS wins unless MF returns are 1.9% higher annually.
What's the real downside of NPS?
Lock-in until age 60 and forced 20% annuity at exit. Not returns—NPS delivers competitive equity returns. Trade-off is liquidity, not performance.
Which NPS fund managers should I choose?
5-year winners: ICICI Prudential (12.13%), Kotak (11.73%), UTI (11.35%), HDFC (11.14%), LIC (11.12%), Aditya Birla (11.09%), SBI (10.26%). Avoid: Tata, Axis, Max Life, DSP—all lagged the index.
The Bottom Line
NPS doesn't underperform. 64% of funds beat Nifty 50 TRI over 5 years—matching large cap MFs' 63%.
The real advantage is tax arbitrage: - 39% bracket: MF needs 12.9% CAGR to match NPS at 11% - 29% of large cap MFs deliver 12.9%+ returns - NPS has 71% odds of winning with employer contribution after accounting for taxes
If you're getting employer contribution: NPS has a meaningful edge (71% vs 29% odds) due to tax arbitrage. The lock-in is a feature, not a bug—it enforces discipline while delivering tax-advantaged returns.
If you're self-contributing: Even in old regime, MF wins by ₹34L over 30 years despite the ₹50K tax deduction. In new regime with zero tax benefit, there's no contest—MF wins decisively.
Either way, the decision should be based on your tax situation and liquidity needs—not on the outdated myth that "NPS underperforms."
Data Sources: NPSNAV GitHub (NPS NAV), MFapi.in (MF NAV), NSE Indices (Nifty 50 TRI)
Analysis Period: June 2021 - June 2026 (5 years)
Nifty 50 TRI: 9.58% CAGR (official NSE data)
Last Updated: June 4, 2026
Disclaimer: Past performance is not indicative of future results. This analysis is for informational purposes only, not investment advice.
Run these numbers on your finances
Arth looks at your full picture and tells you what actually matters.
Try Arth →