Your Regular Mutual Fund Cost You ₹1.58 Lakh — Here's the Fund-by-Fund Breakdown
TL;DR: I ran a ₹10,000/month SIP simulation on 5 popular funds using actual NAV data from 2016-2026. The average investor in regular plans lost ₹1.58 lakh to commissions. Small cap funds were the worst — Nippon India Small Cap alone cost ₹2.43 lakh. Even "safe" large caps cost over ₹1 lakh.
The Question
Everyone says "direct plans are cheaper." But by how much, exactly? Not in percentages — in rupees. For the specific funds you probably own.
I wanted a concrete answer: if you'd been in direct instead of regular for the last 10 years, how much more money would you have today?
What I Did
I pulled actual daily NAV data from AMFI for 5 of India's most popular equity funds — one from each major segment. Then I simulated a ₹10,000/month SIP from January 2016 to May 2026 (125 installments, ₹12.5 lakh total invested) on both the direct and regular plan of each fund.
No assumptions. No projected returns. Just real NAVs, real dates, real math.
Funds analyzed: - HDFC Flexi Cap Fund (Flexi Cap) - SBI Large Cap Fund (Large Cap) - HDFC Mid Cap Fund (Mid Cap) - Nippon India Small Cap Fund (Small Cap) - ICICI Prudential Equity & Debt Fund (Hybrid)
The Findings
| Fund | Segment | Direct Corpus | Regular Corpus | You Lost |
|---|---|---|---|---|
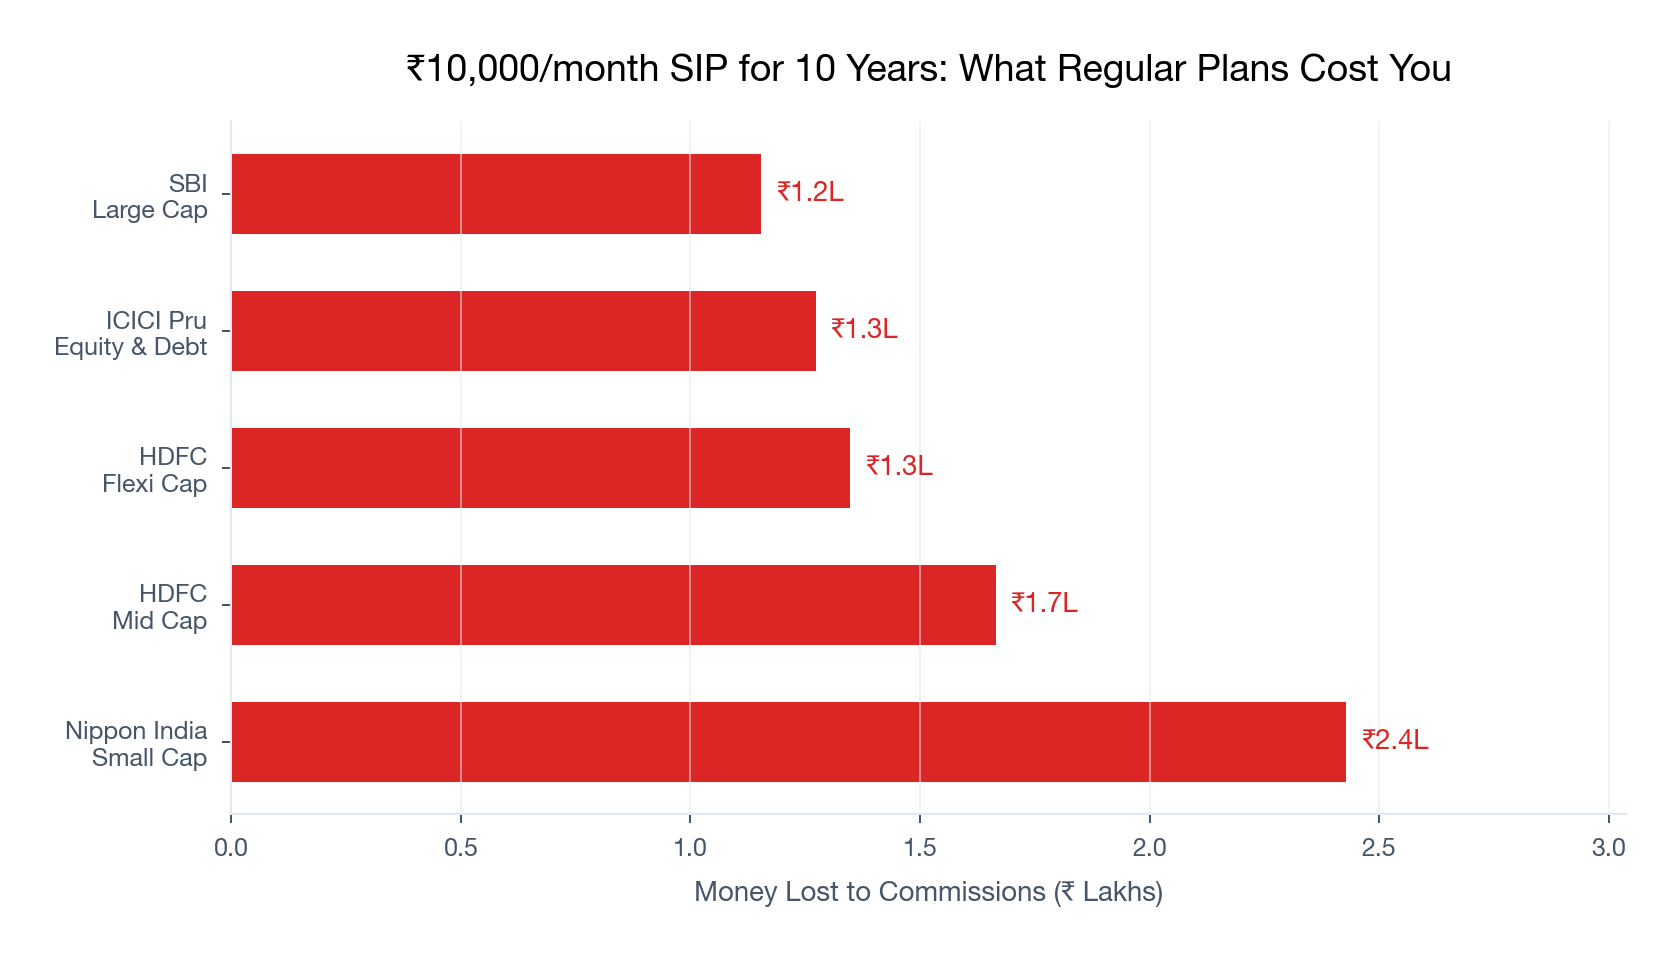
| Nippon India Small Cap | Small Cap | ₹41.9L | ₹39.5L | ₹2.43L |
| HDFC Mid Cap | Mid Cap | ₹36.4L | ₹34.7L | ₹1.67L |
| HDFC Flexi Cap | Flexi Cap | ₹31.9L | ₹30.5L | ₹1.35L |
| ICICI Pru Equity & Debt | Hybrid | ₹31.0L | ₹29.7L | ₹1.28L |
| SBI Large Cap | Large Cap | ₹24.9L | ₹23.7L | ₹1.16L |
Average loss: ₹1.58 lakh across 5 funds. On ₹12.5 lakh invested, that's 12.6% of your entire investment gone to distributor commissions.
The Pattern: Smaller Caps = Bigger Damage
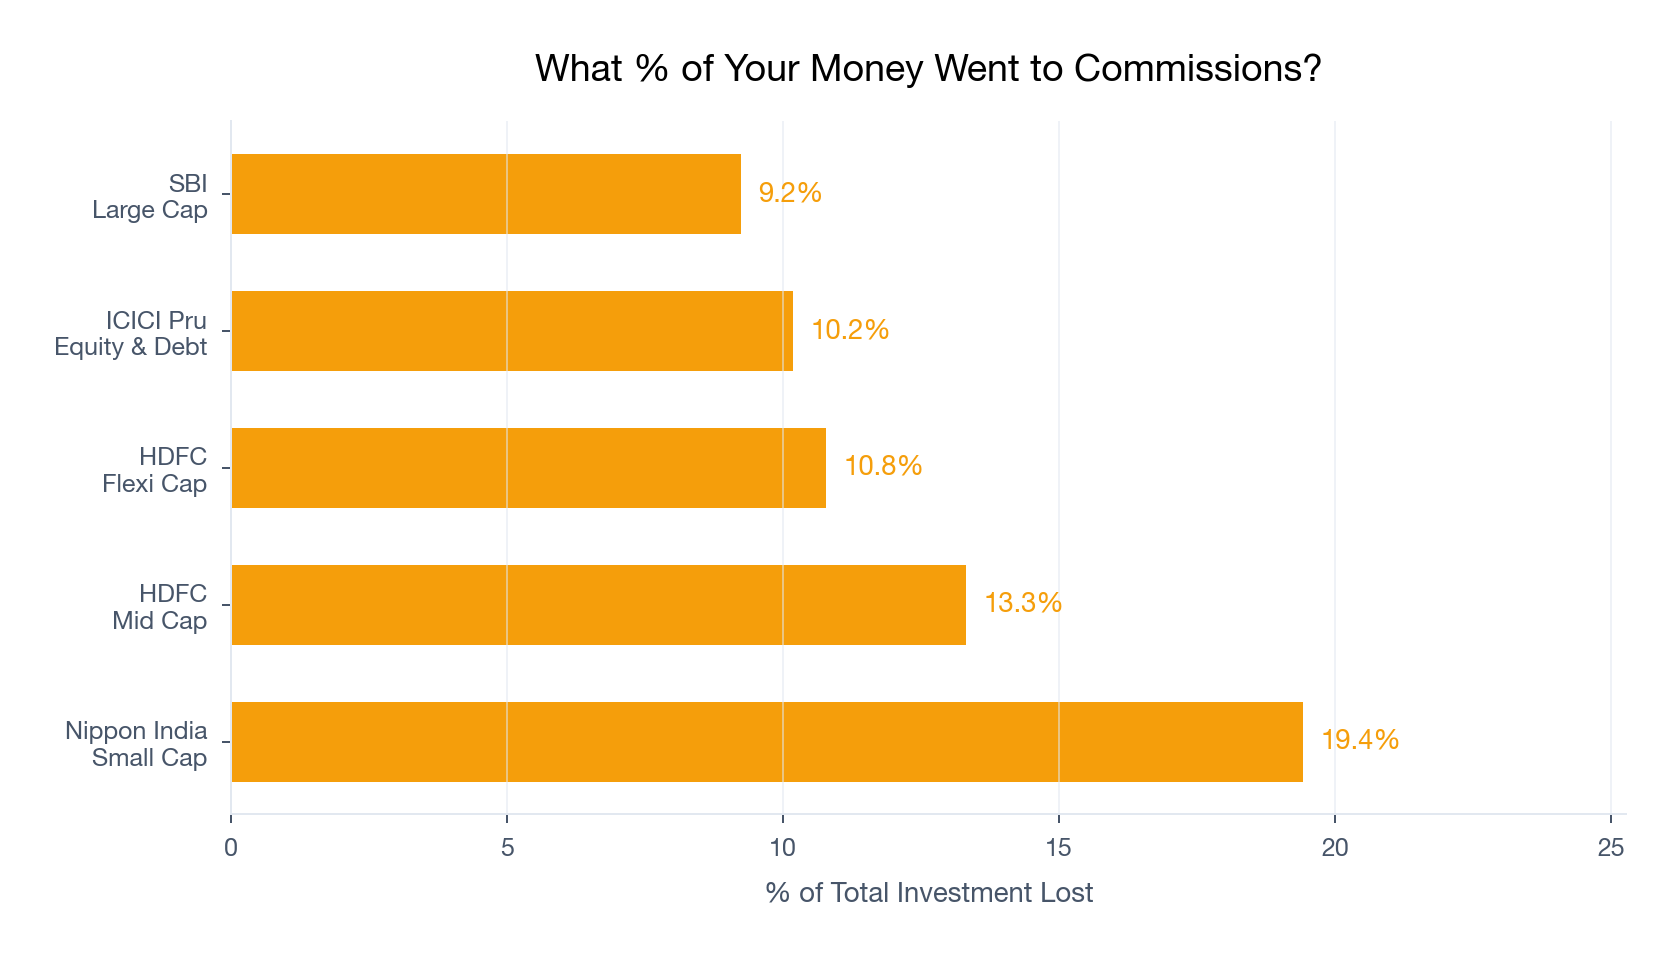
Small cap funds charge the highest expense ratios — and because they also deliver higher absolute returns, the compounding effect of that cost gap is amplified. Nippon India Small Cap's regular plan ate 19.4% of your total investment. Nearly one-fifth.
Large caps are the "least bad" at 9.2% — but that's still ₹1.16 lakh on a modest ₹10K SIP.
What If Your SIP Is Larger?
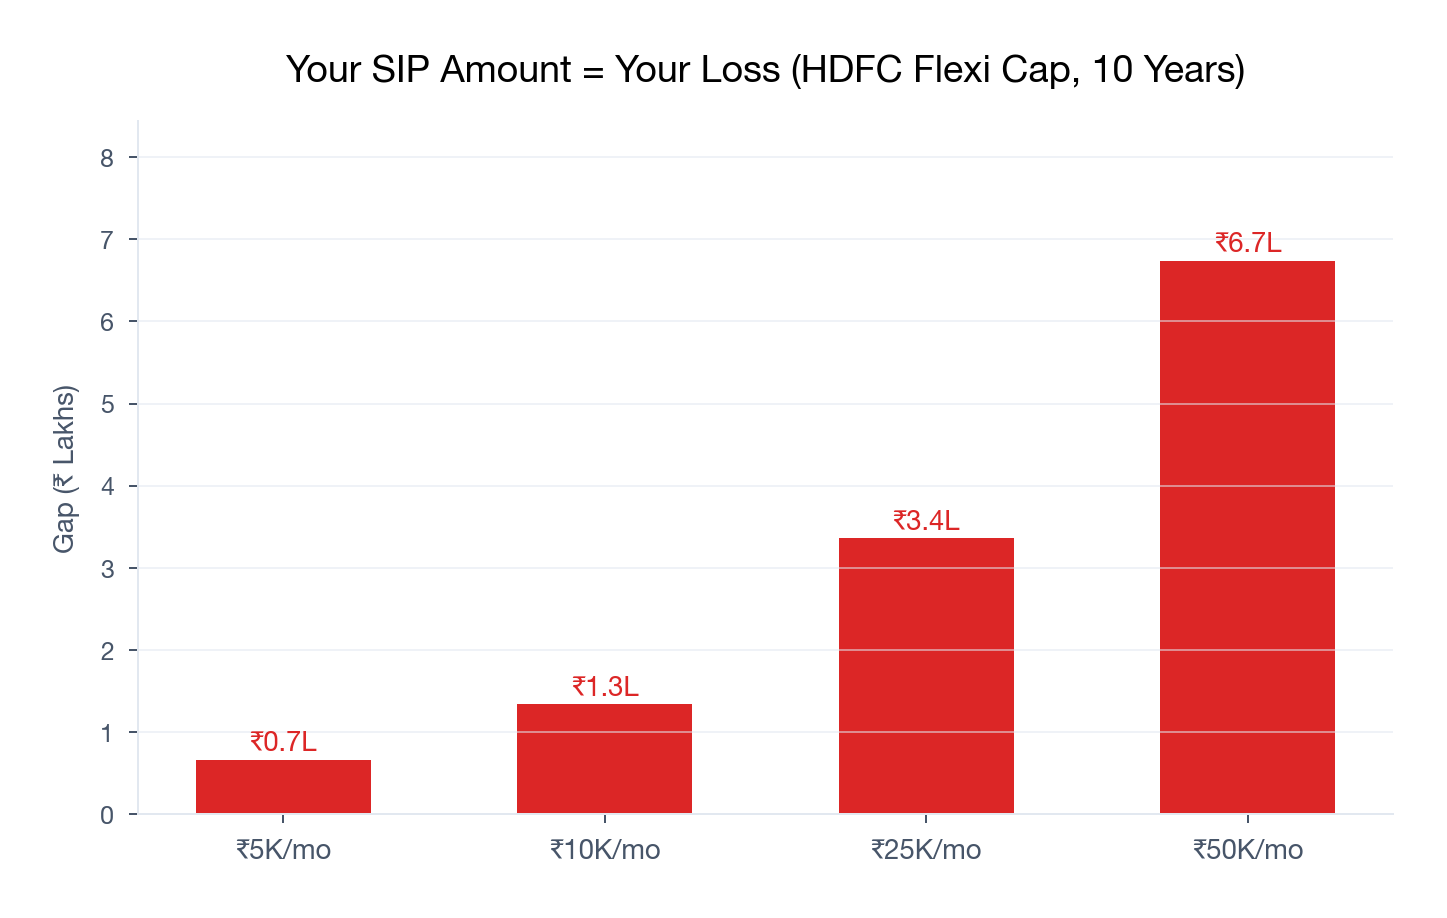
The gap scales linearly with your SIP amount:
| Your Monthly SIP | You Lost (HDFC Flexi Cap) |
|---|---|
| ₹5,000 | ₹67,500 |
| ₹10,000 | ₹1.35 lakh |
| ₹25,000 | ₹3.37 lakh |
| ₹50,000 | ₹6.75 lakh |
At ₹50K/month, you're losing ₹6.75 lakh in a single fund. If you hold 3-4 funds in regular plans, the total damage crosses ₹15-20 lakh easily.
What This Means For You
The "it's just 1%" narrative is a ₹1.5 lakh lie — at minimum. For small/mid cap investors or anyone with a larger SIP, it's much worse.
Three things to do:
-
Check which of your funds are in regular plans. Download your CAS from MFCentral — it shows the plan type for each holding.
-
Start all new SIPs in direct today. This costs nothing and has zero tax implications. Every month you delay is money lost.
-
Switch existing holdings gradually. If your gains are under ₹1.25 lakh, switch tax-free. Above that, switch in yearly tranches. Here's our step-by-step guide →
The Counterargument: When This Cost Is Worth Paying
Not everyone should switch. In our detailed comparison, we identified scenarios where regular plans genuinely make sense:
- You'd otherwise not invest at all. A distributor who moved you from FDs to equity earned that commission — 11% minus 1% still beats 6%.
- You panic-sell without guidance. Regular plan investors hold longer (21.2% held >5 years vs 7.7% in direct). If your distributor's phone call during a crash saved you from redeeming ₹30 lakh at the bottom, that's worth far more than ₹1.58 lakh.
- Your portfolio is under ₹5 lakh. The absolute gap is small, and a fee-only advisor would cost more.
The question isn't "is 1% too much?" — it's "am I getting ₹1.58 lakh worth of value over 10 years?" If your distributor does active goal planning, rebalancing, and crash-time handholding — maybe. If the relationship is an annual statement and a Diwali greeting — definitely not.
Try It With Your Own Numbers
We're building this exact analysis into Arth — plug in your funds, your SIP amounts, and see your personal ₹ gap in real-time. Try Arth →
Data: Actual daily NAV from AMFI via mfapi.in (Jan 2016 – May 2026) Method: Monthly SIP on 1st of each month (or next trading day), 125 installments Code: Available in our GitHub for verification
Run these numbers on your finances
Arth looks at your full picture and tells you what actually matters.
Try Arth →